

Question: Given the data below by using minitab 1, plot the data 2, evaluate the trend, and seasonal variation if there are any 3, evaluate ACF,
Given the data below
by using minitab
1, plot the data 2, evaluate the trend, and seasonal variation if there are any 3, evaluate ACF, PACF, and variogram 4, create a new column of first order differences and repeat part 1-4 5, Make a guess about possible models for the data, Estimate parameters in ARMA after save residuals and create ACF & PACF of residuals and interpret the output. Evaluate normality of residuals (state Ho and Ha of normality test) State your model and explain why the one you choose is the most adequate model among the others support with brief statements.
can you please use that and write it down carefully chegg app isn't accepting Excel
66- 41.07 67- 39.63 68- 37.34
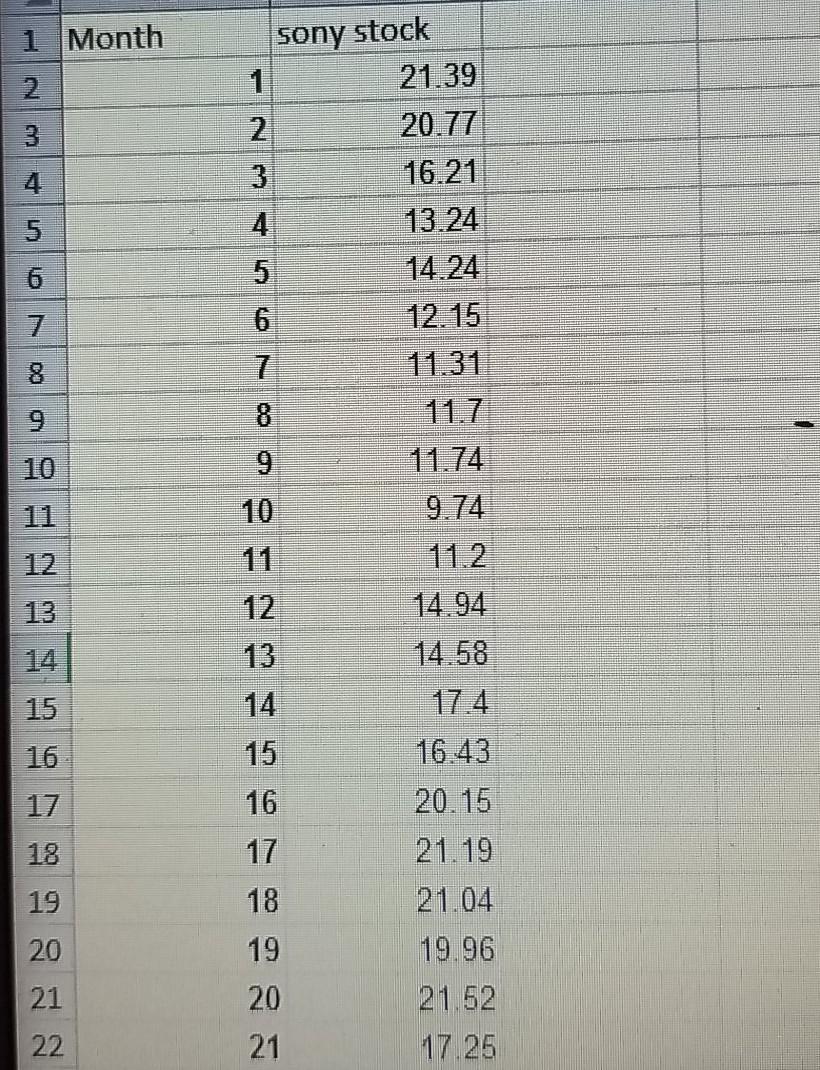
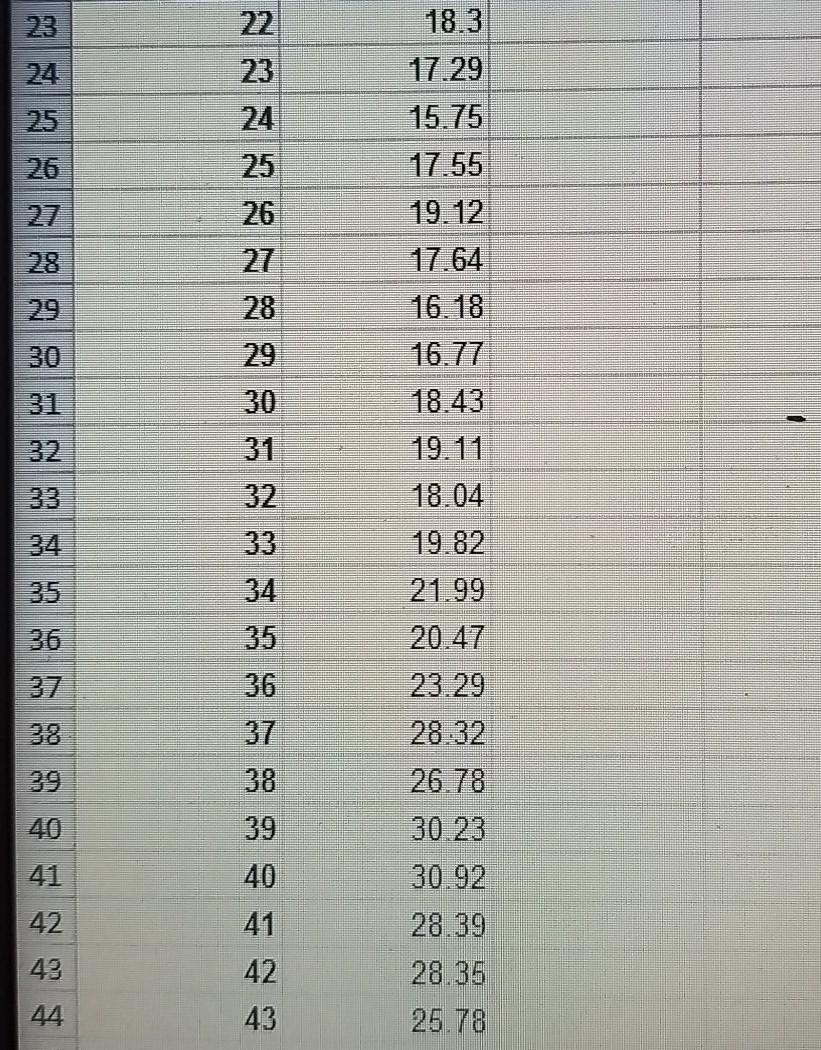
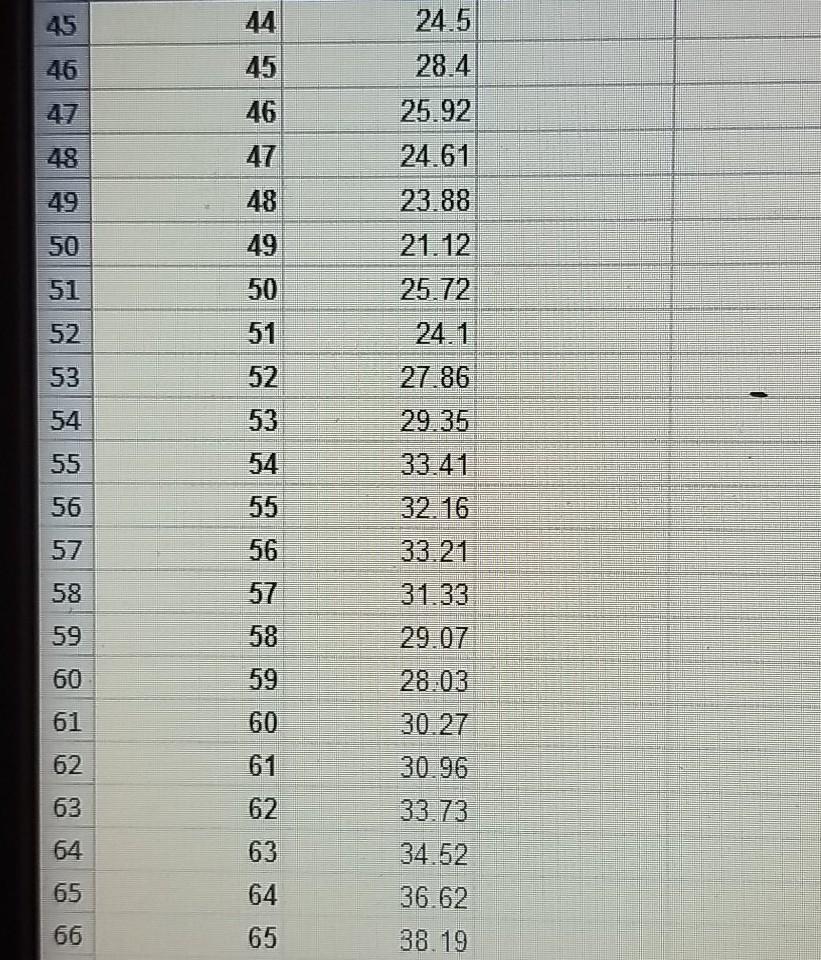
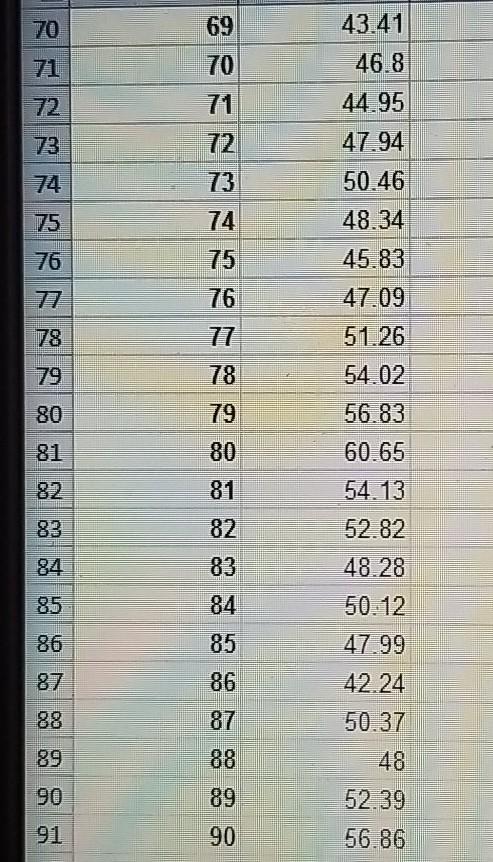
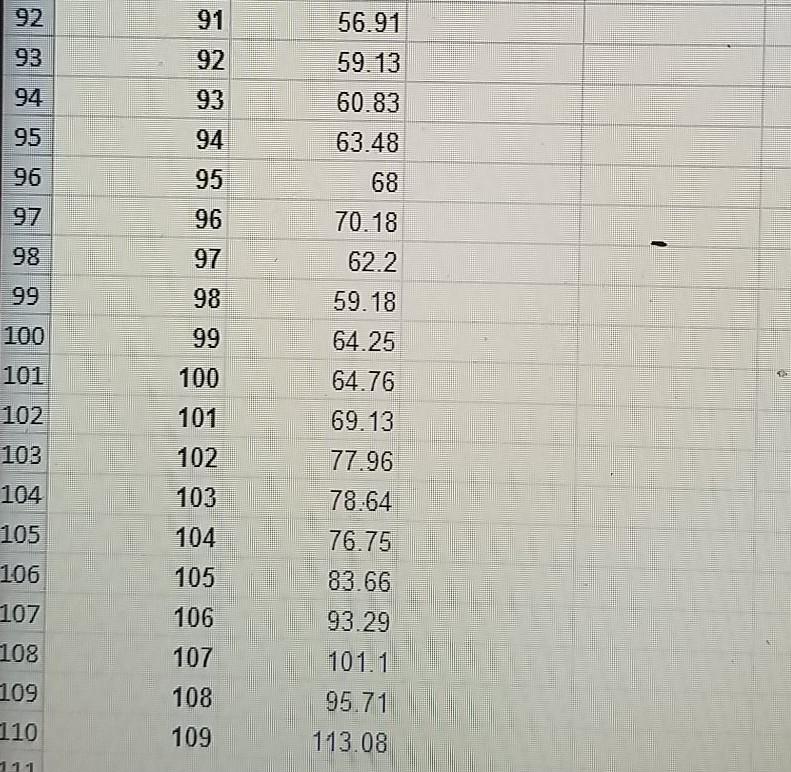
1 Month sony stock ON 1 2 3 3 4 5 6 7 04 O co o un 21.39 20.77 16.21 13.24 14.24 12.15 11.31 11.7 11.74 9.74 11.2 14.94 14.58 9 am TUTE 2 12 13 15 16 15 17 16 18 19 16.43 20.15 21.19 21.04 19.96 21.52 17.25 18 19 20 21 20 21 22 22 25 26 25 26 27 28 GYE 32 28 29 30 31 32 33 34 18.3 17.29 15.75 17.55 19.12 17.64 16.18 16.77 18.43 19.11 18.04 19.82 21.99 20.47 23.29 28.32 26.78 30.23 30.92 28.39 28.35 25.78 3 3 7 36 00 37 38 4 42 39 40 41 42 43 43 44 45 44 46 45 46 48 47 48 24.5 28.4 25.92 24.61 23.88 21.12 25.72 49 50 49 51 50 52 51 24.1 53 52 27.86 54 29.35 55 33.41 32.16 56 55 57 56 33.21 58 57 31.33 59 58 29.07 59 28.03 61 60 62 61 63 62 30.27 30.96 33.73 34.52 36.62 38.19 64 63 65 64 66 65 70 69 70 71 43.41 46.8 44.95 47.94 73 50.46 2 75 74 48.34 76 75 76 45.83 109 526 54.02 78 T 78 80 79 81 80 81 82 84 83 56.83 60.65 54.13 52.82 48.28 50.12 47.99 42.24 50.37 85 84 86 85 87 86 87 89 48 90 89 52.39 56.86 91 90 91 93 92 56.91 59.13 60.83 63.48 94 93 95 94 96 95 96 98 97 99 98 100 99 101 100 102 101 103 102 68 70.18 62.2 59.18 64.25 64.76 69.13 77.96 78.64 76.75 83.66 93.29 101.1 95.71 113.08 104 105 103 104 105 106 107 106 107 108 109 108 110 111 109 1 Month sony stock ON 1 2 3 3 4 5 6 7 04 O co o un 21.39 20.77 16.21 13.24 14.24 12.15 11.31 11.7 11.74 9.74 11.2 14.94 14.58 9 am TUTE 2 12 13 15 16 15 17 16 18 19 16.43 20.15 21.19 21.04 19.96 21.52 17.25 18 19 20 21 20 21 22 22 25 26 25 26 27 28 GYE 32 28 29 30 31 32 33 34 18.3 17.29 15.75 17.55 19.12 17.64 16.18 16.77 18.43 19.11 18.04 19.82 21.99 20.47 23.29 28.32 26.78 30.23 30.92 28.39 28.35 25.78 3 3 7 36 00 37 38 4 42 39 40 41 42 43 43 44 45 44 46 45 46 48 47 48 24.5 28.4 25.92 24.61 23.88 21.12 25.72 49 50 49 51 50 52 51 24.1 53 52 27.86 54 29.35 55 33.41 32.16 56 55 57 56 33.21 58 57 31.33 59 58 29.07 59 28.03 61 60 62 61 63 62 30.27 30.96 33.73 34.52 36.62 38.19 64 63 65 64 66 65 70 69 70 71 43.41 46.8 44.95 47.94 73 50.46 2 75 74 48.34 76 75 76 45.83 109 526 54.02 78 T 78 80 79 81 80 81 82 84 83 56.83 60.65 54.13 52.82 48.28 50.12 47.99 42.24 50.37 85 84 86 85 87 86 87 89 48 90 89 52.39 56.86 91 90 91 93 92 56.91 59.13 60.83 63.48 94 93 95 94 96 95 96 98 97 99 98 100 99 101 100 102 101 103 102 68 70.18 62.2 59.18 64.25 64.76 69.13 77.96 78.64 76.75 83.66 93.29 101.1 95.71 113.08 104 105 103 104 105 106 107 106 107 108 109 108 110 111 109
Step by Step Solution
There are 3 Steps involved in it

Get step-by-step solutions from verified subject matter experts