

Question: Given the data from the following table: and the calculated average returns and standard deviations in the following table: a. Which asset was riskiest? b.
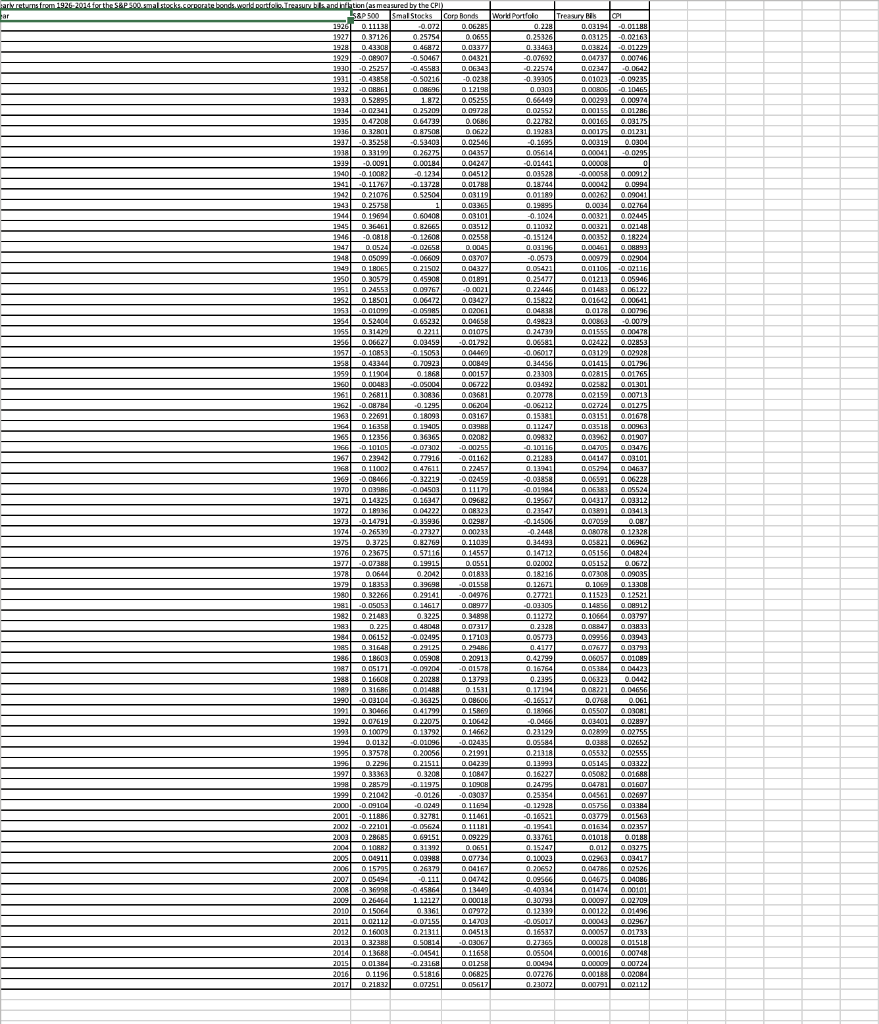
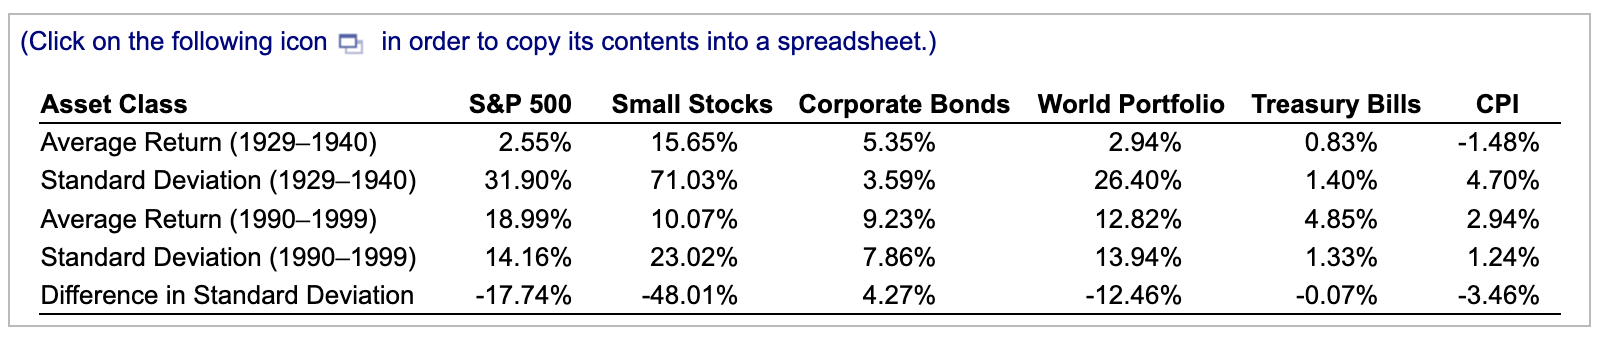
Given the data from the following table: and the calculated average returns and standard deviations in the following table: a. Which asset was riskiest? b. Compare the standard deviations of the assets in the 1990s to their standard deviations in the Great Depression (the 1930s). Which had the greatest difference between the two periods? c. From just looking at the data from the 1990s, what would you conclude about small stocks? a. Over the period shown in the table, which asset was riskiest? (Select from the drop-down menu.) The riskiest asset class was Click on the following icon in order to copy its contents into a spreadsheet.) Given the data from the following table: and the calculated average returns and standard deviations in the following table: a. Which asset was riskiest? b. Compare the standard deviations of the assets in the 1990s to their standard deviations in the Great Depression (the 1930s). Which had the greatest difference between the two periods? c. From just looking at the data from the 1990s, what would you conclude about small stocks? a. Over the period shown in the table, which asset was riskiest? (Select from the drop-down menu.) The riskiest asset class was Click on the following icon in order to copy its contents into a spreadsheet.)
Step by Step Solution
There are 3 Steps involved in it

Get step-by-step solutions from verified subject matter experts