

Question: Given the data in the picture below, please make a histogram and frequency polygon. ? rd Font aber Editing F19 (x-mean)2 A B C D
Given the data in the picture below, please make a histogram and frequency polygon.
?
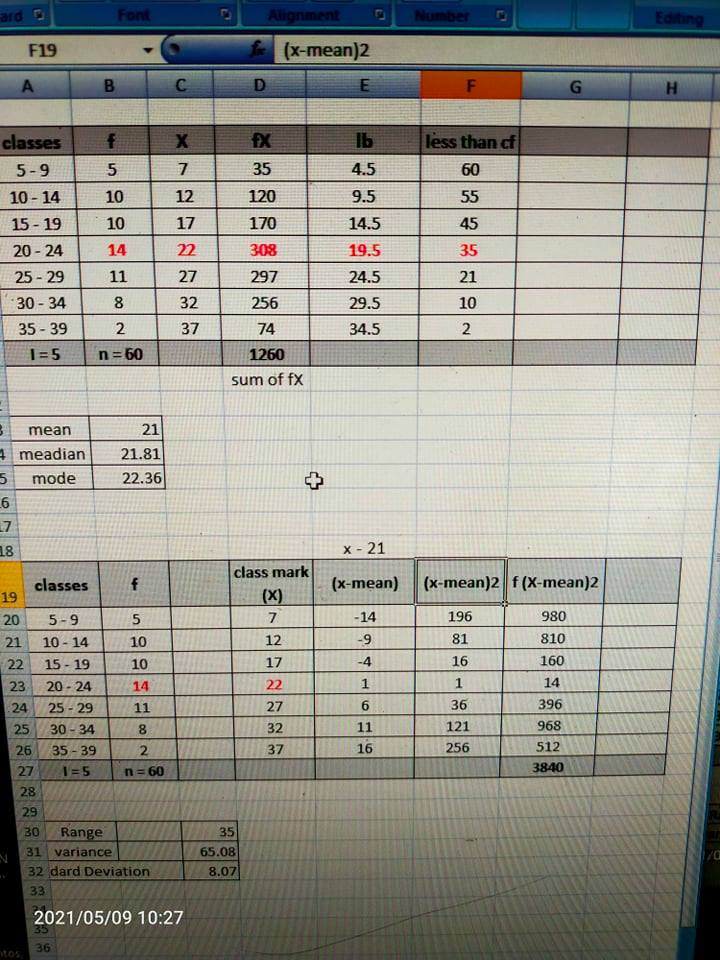
rd Font aber Editing F19 (x-mean)2 A B C D E F G H classes f X EX Ib less than of 5- 9 5 7 35 4.5 60 10 - 14 10 12 120 9.5 55 15 - 19 10 17 170 14.5 45 20 - 24 14 22 308 19.5 35 25 - 29 11 27 297 24.5 21 30 - 34 8 32 256 29.5 10 35- 39 2 37 74 34.5 2 1 =5 n =60 1260 sum of fx mean 21 meadian 21.81 mode 22.36 6 8 x - 21 class mark classes ch (x-mean) (x-mean)2 |f (X-mean)2 19 (X) 20 5-9 5 7 -14 196 980 21 10 - 14 10 12 -9 81 810 22 15 - 19 10 17 -4 16 160 23 20 - 24 14 22 1 1 14 24 25 - 29 11 27 6 36 396 25 30 - 34 8 32 11 121 168 26 35 -39 2 37 16 256 512 27 1=5 n =60 3840 28 29 30 Range 35 31 |variance 65.08 32 dard Deviation 8.07 33 2021/05/09 10:27 35 36
Step by Step Solution
There are 3 Steps involved in it

Get step-by-step solutions from verified subject matter experts