

Question: Given the data listed in the table below, calculate the lower and upper bound of the 95% prediction interval for the response variable at X
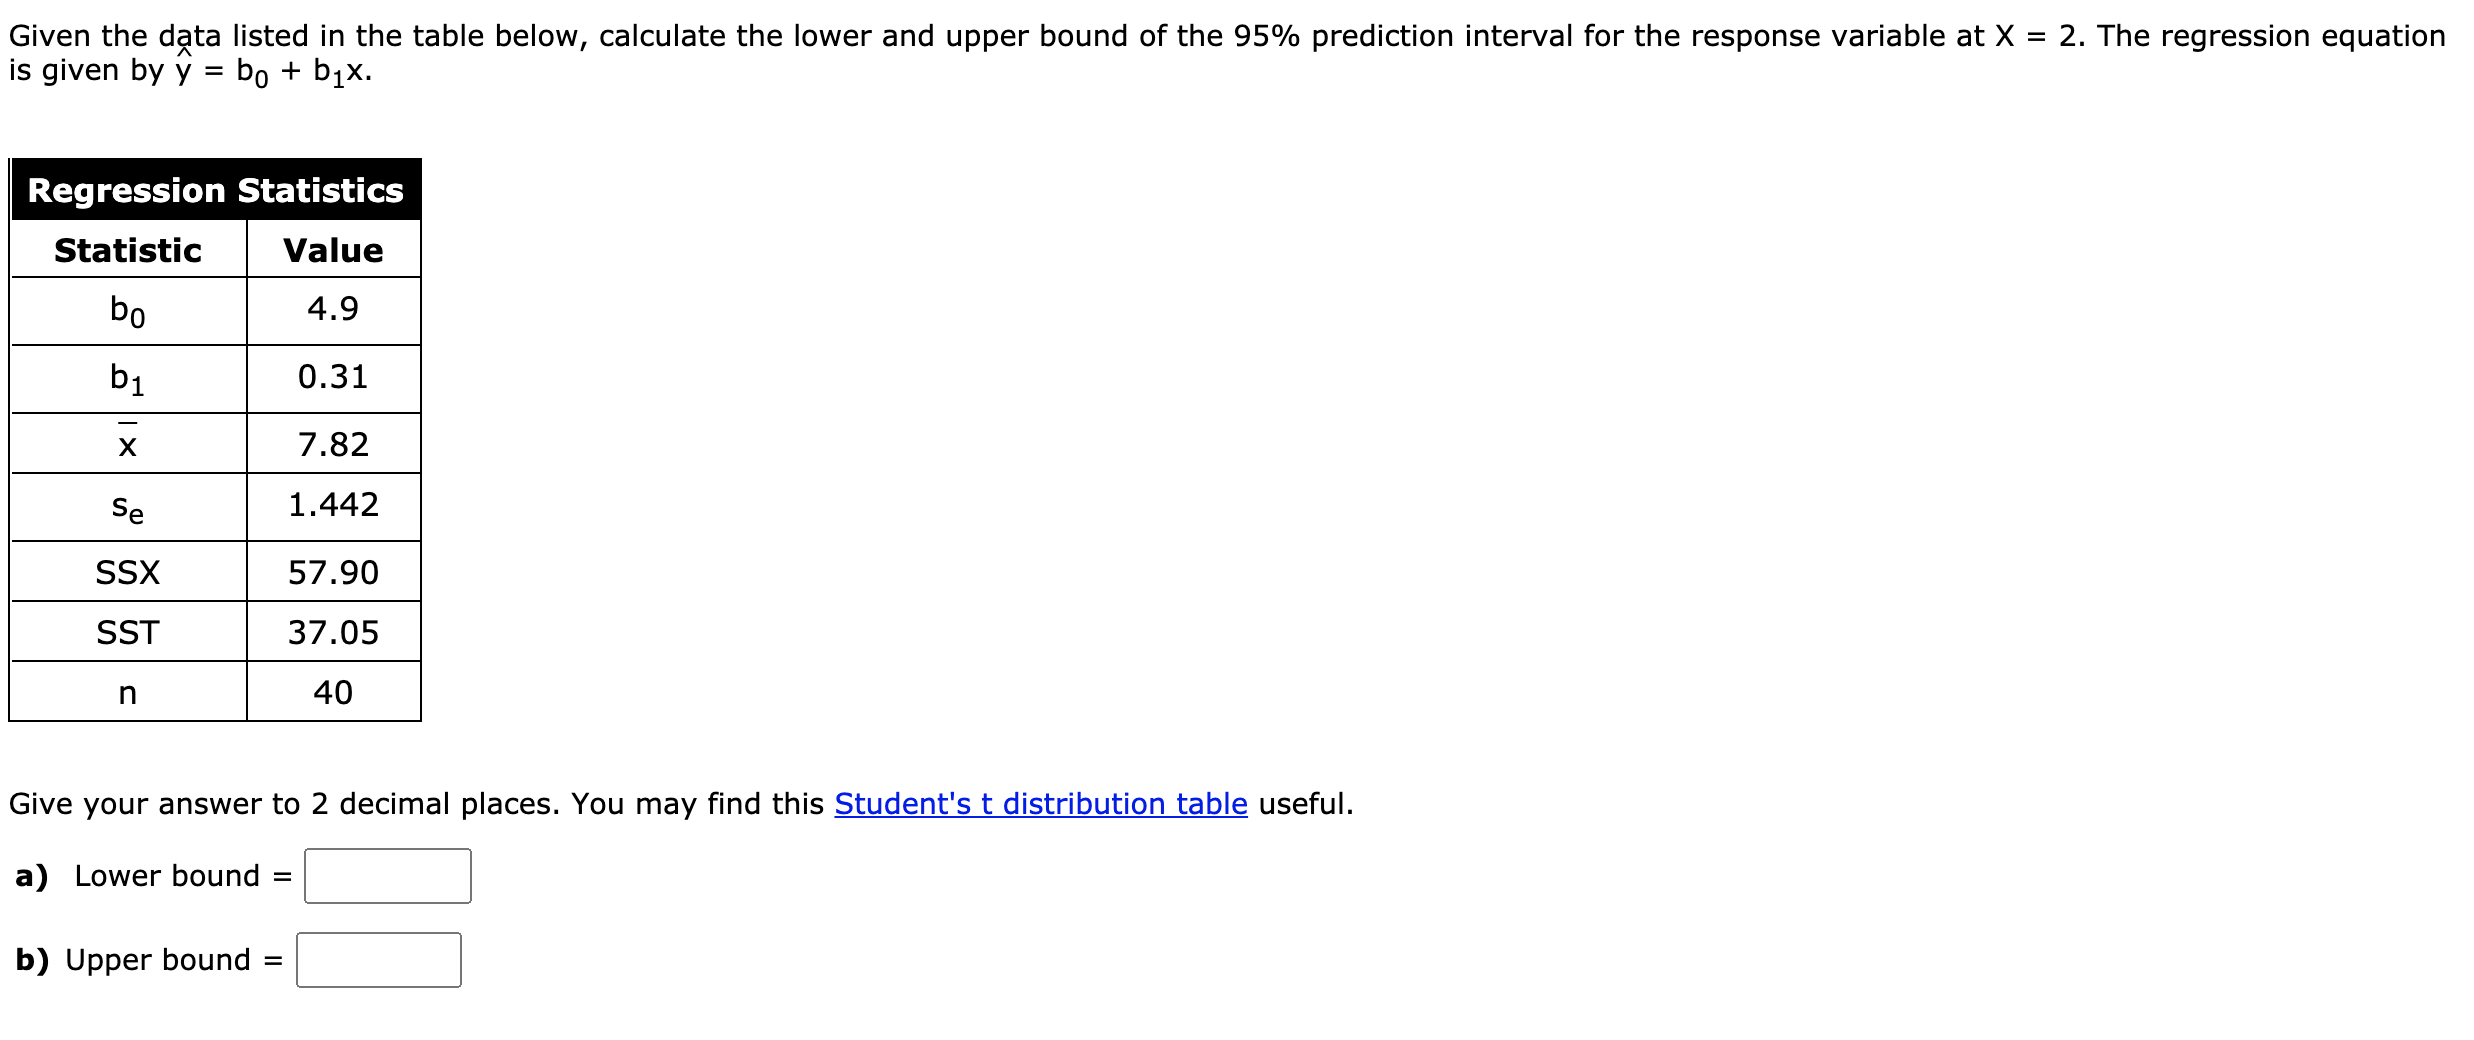
Given the data listed in the table below, calculate the lower and upper bound of the 95% prediction interval for the response variable at X = 2. The regression equation is given by y = b0 + blx. Regression Statistics Statistic Give your answer to 2 decimal places. You may find this Student's t distribution table useful. a) Lower bound = b) Upper bound = C]
Step by Step Solution
There are 3 Steps involved in it
1 Expert Approved Answer
Step: 1 Unlock

Question Has Been Solved by an Expert!
Get step-by-step solutions from verified subject matter experts
Step: 2 Unlock
Step: 3 Unlock