

Question: Given the data shown for an 8 hour period, create xbar and s chart, bring into control by elimination of out of control points, if
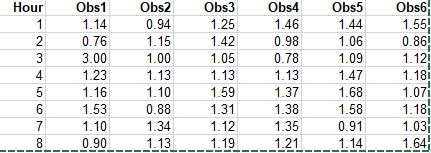
Given the data shown for an 8 hour period, create xbar and s chart, bring into control by elimination of out of control points, if necessary, and provide estimates for process mean and standard deviation.
\f
Step by Step Solution
There are 3 Steps involved in it
1 Expert Approved Answer
Step: 1 Unlock

Question Has Been Solved by an Expert!
Get step-by-step solutions from verified subject matter experts
Step: 2 Unlock
Step: 3 Unlock