

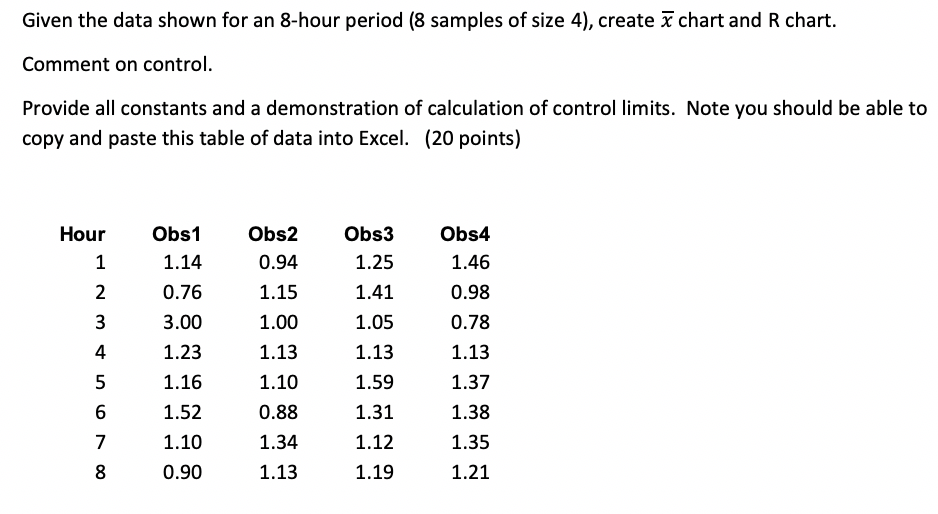
Question: Given the data shown for an 8-hour period (8 samples of size 4), create x chart and R chart. Comment on control. Provide all constants
Step by Step Solution
There are 3 Steps involved in it
1 Expert Approved Answer
Step: 1 Unlock

Question Has Been Solved by an Expert!
Get step-by-step solutions from verified subject matter experts
Step: 2 Unlock
Step: 3 Unlock