

Question: Given the data shown, for time periods in months ( t ) and demand ( y ) - Does the data exhibit any trends? Draw
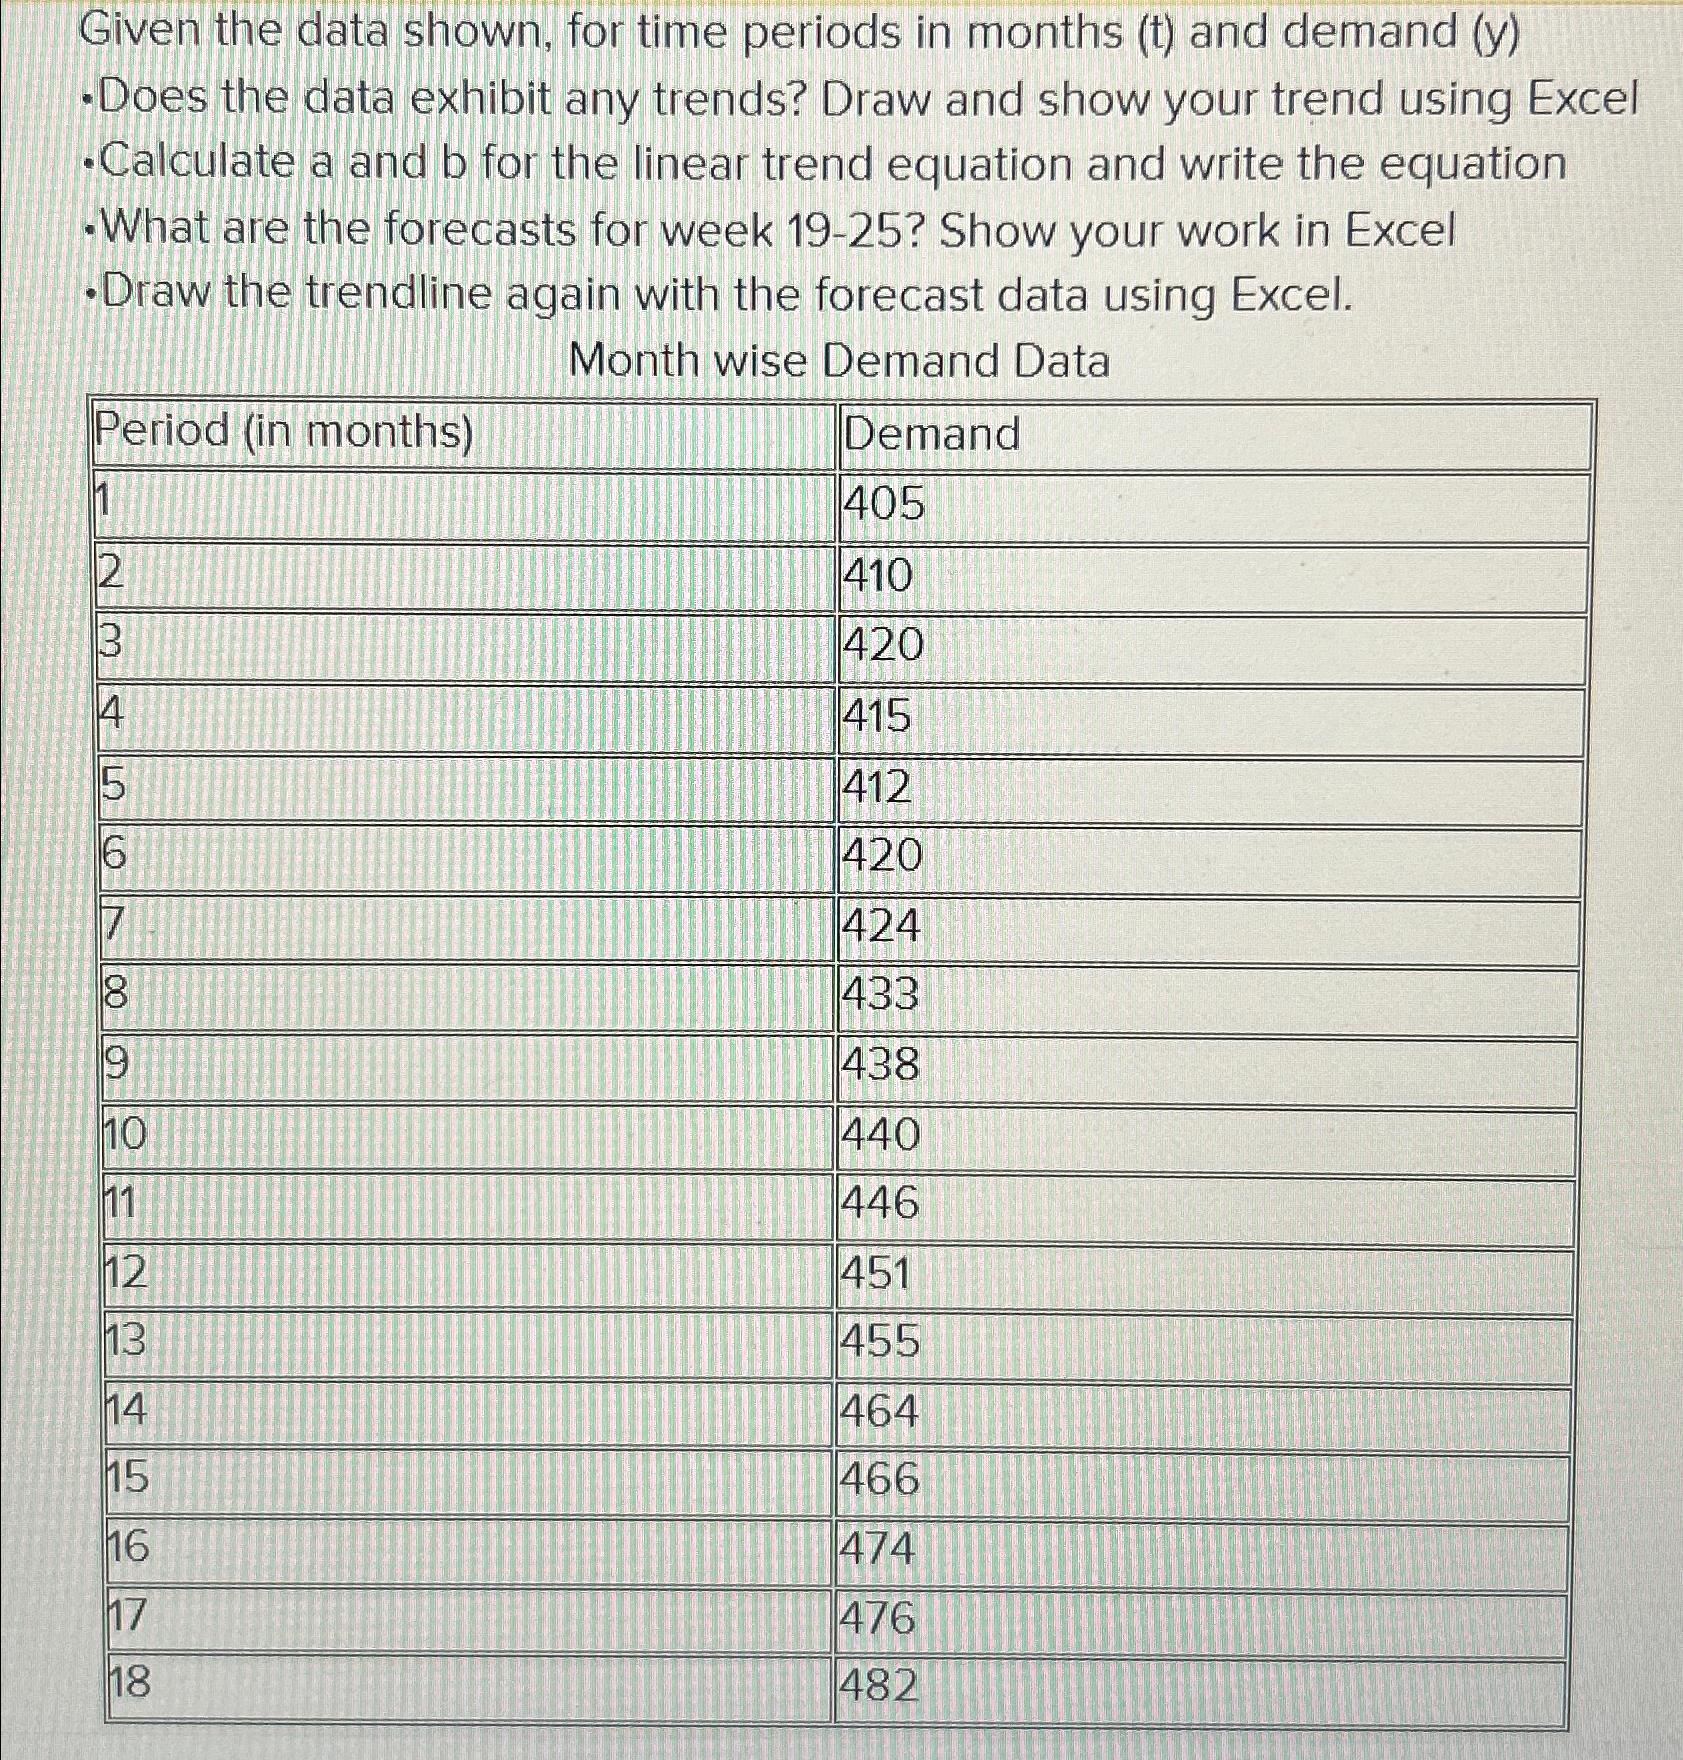
Given the data shown, for time periods in months and demand
Does the data exhibit any trends? Draw and show your trend using Excel
Calculate a and for the linear trend equation and write the equation
What are the forecasts for week Show your work in Excel
Draw the trendline again with the forecast data using Excel.
Month wise Demand Data
tablePeriod in monthsDemand
Step by Step Solution
There are 3 Steps involved in it
1 Expert Approved Answer
Step: 1 Unlock

Question Has Been Solved by an Expert!
Get step-by-step solutions from verified subject matter experts
Step: 2 Unlock
Step: 3 Unlock