Question: Show your work please 1. Given the data shown above, use =.2 and =.4 to create trend enhanced smoothing based forecasts for period 7 .

Show your work please Show your work please 1. Given the data shown

1. Given the data shown above, use =.2 and =.4 to create trend enhanced smoothing based forecasts for period 7 . Assume that FIT1 = 22 and T1=7.83 2. Repeat problem 1 using =.4 and =.8. Which model (from problem 1 or problem 2) gives a better approximation of the demand pattern for periods 1 through 6 ? (Hint: Base your decision on which is better using one of the forecast error calculations as support)

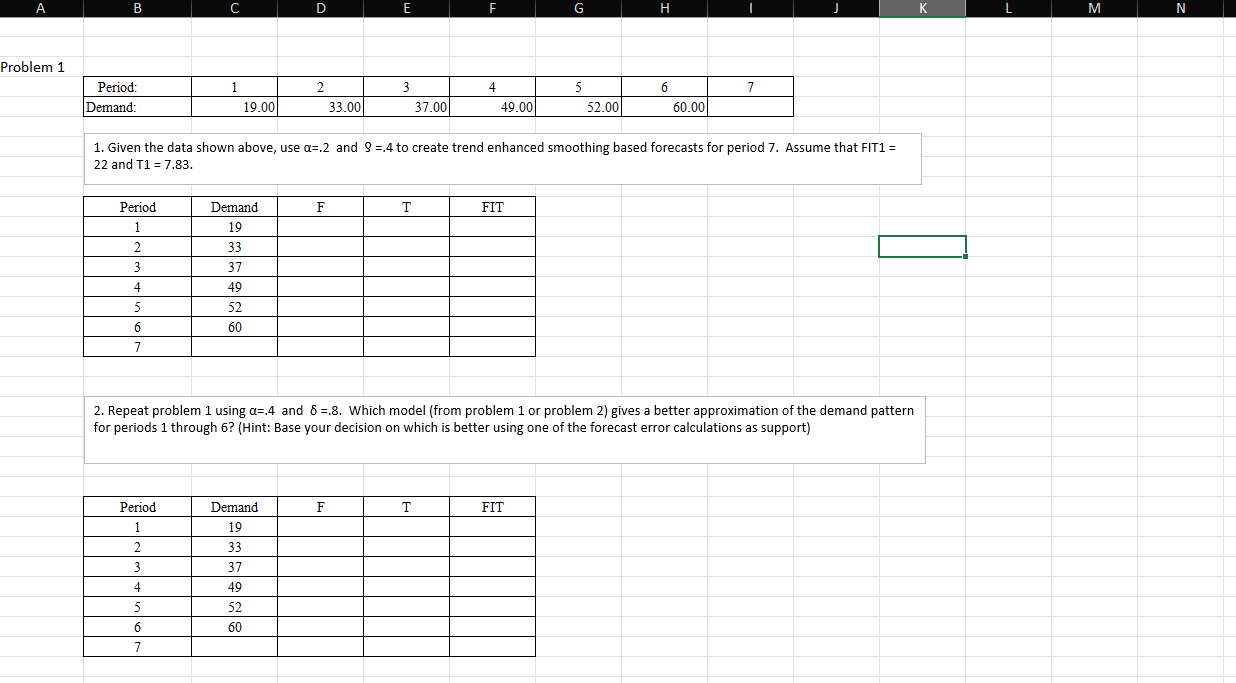
Step by Step Solution

There are 3 Steps involved in it

1 Expert Approved Answer
Step: 1 Unlock blur-text-image
Question Has Been Solved by an Expert!

Get step-by-step solutions from verified subject matter experts

Step: 2 Unlock
Step: 3 Unlock

Students Have Also Explored These Related General Management Questions!