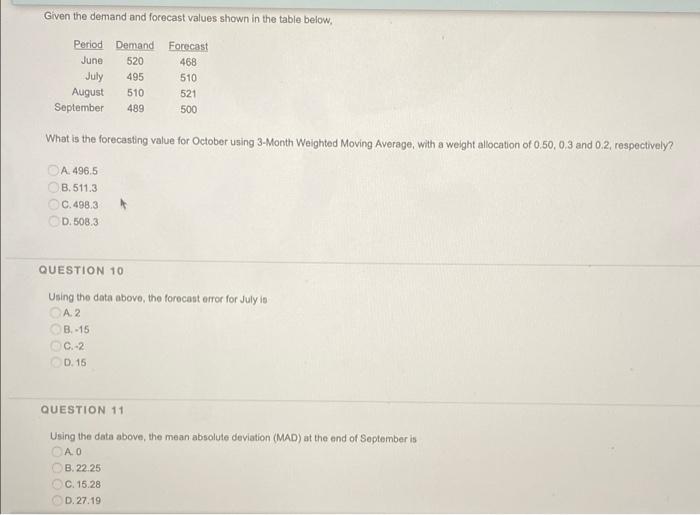
Question: Given the demand and forecast values shown in the table below, Period Demand Forecast June 520 468 495 510 August 510 521 September 489 500

Given the demand and forecast values shown in the
Given the demand and forecast values shown in the table below, Period Demand Forecast June 520 468 495 510 August 510 521 September 489 500 July What is the forecasting value for October using 3-Month Weighted Moving Average, with a weight allocation of 0.50, 0,3 and 0.2, respectively? A. 496.5 B.511.3 0.498.3 D. 508.3 QUESTION 10 Using the data above, the forecast error for July in A. 2 B.-15 C.-2 0.15 QUESTION 11 Using the data above, the mean absoluto deviation (MAD) at the end of September is B.22.25 C. 15.28 D. 27.19

Step by Step Solution

There are 3 Steps involved in it

1 Expert Approved Answer
Step: 1 Unlock blur-text-image
Question Has Been Solved by an Expert!

Get step-by-step solutions from verified subject matter experts

Step: 2 Unlock
Step: 3 Unlock

Students Have Also Explored These Related General Management Questions!