

Question: Given the diagram below, what are mean & SD? What is the peak value of the curve and why? Normal curve formula 1 f(x)=
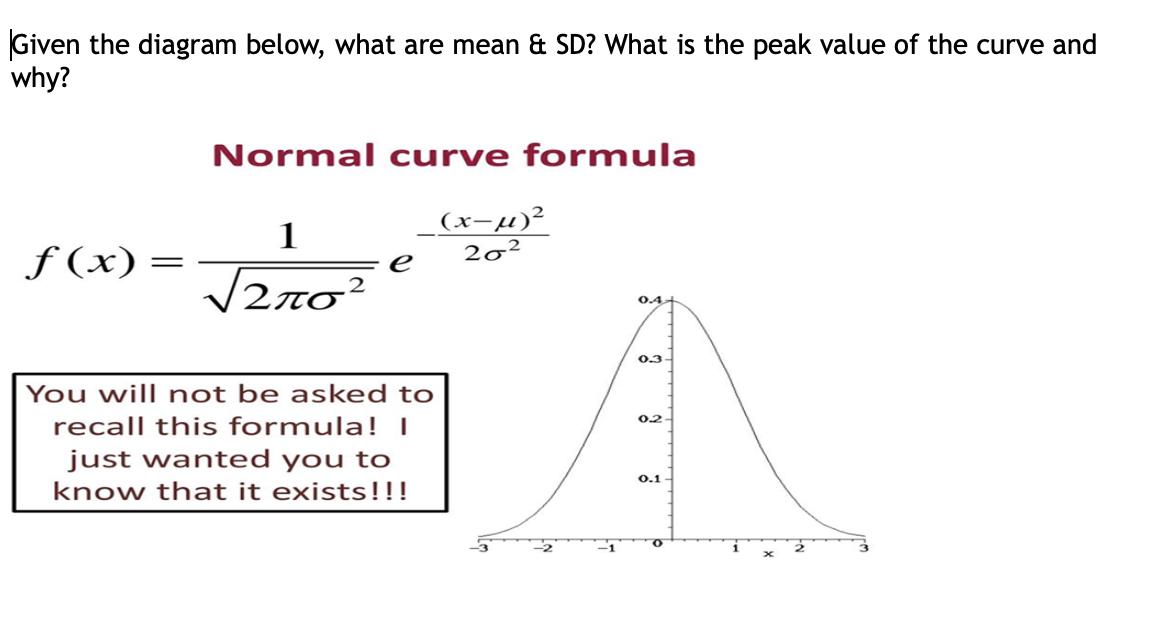
Given the diagram below, what are mean & SD? What is the peak value of the curve and why? Normal curve formula 1 f(x)= (x-) 202 e 2? 0.4 0.3- You will not be asked to recall this formula! I just wanted you to know that it exists!!! 0.2 O.1
Step by Step Solution
There are 3 Steps involved in it
1 Expert Approved Answer
Step: 1 Unlock

Question Has Been Solved by an Expert!
Get step-by-step solutions from verified subject matter experts
Step: 2 Unlock
Step: 3 Unlock