

Question: Given the financial summary answer the question below. Financial Summary 2019 2018 2017 As Adjusted (a) 2016 As Adjusted 2015 As Adjusted (b) FINANCIAL RESULTS
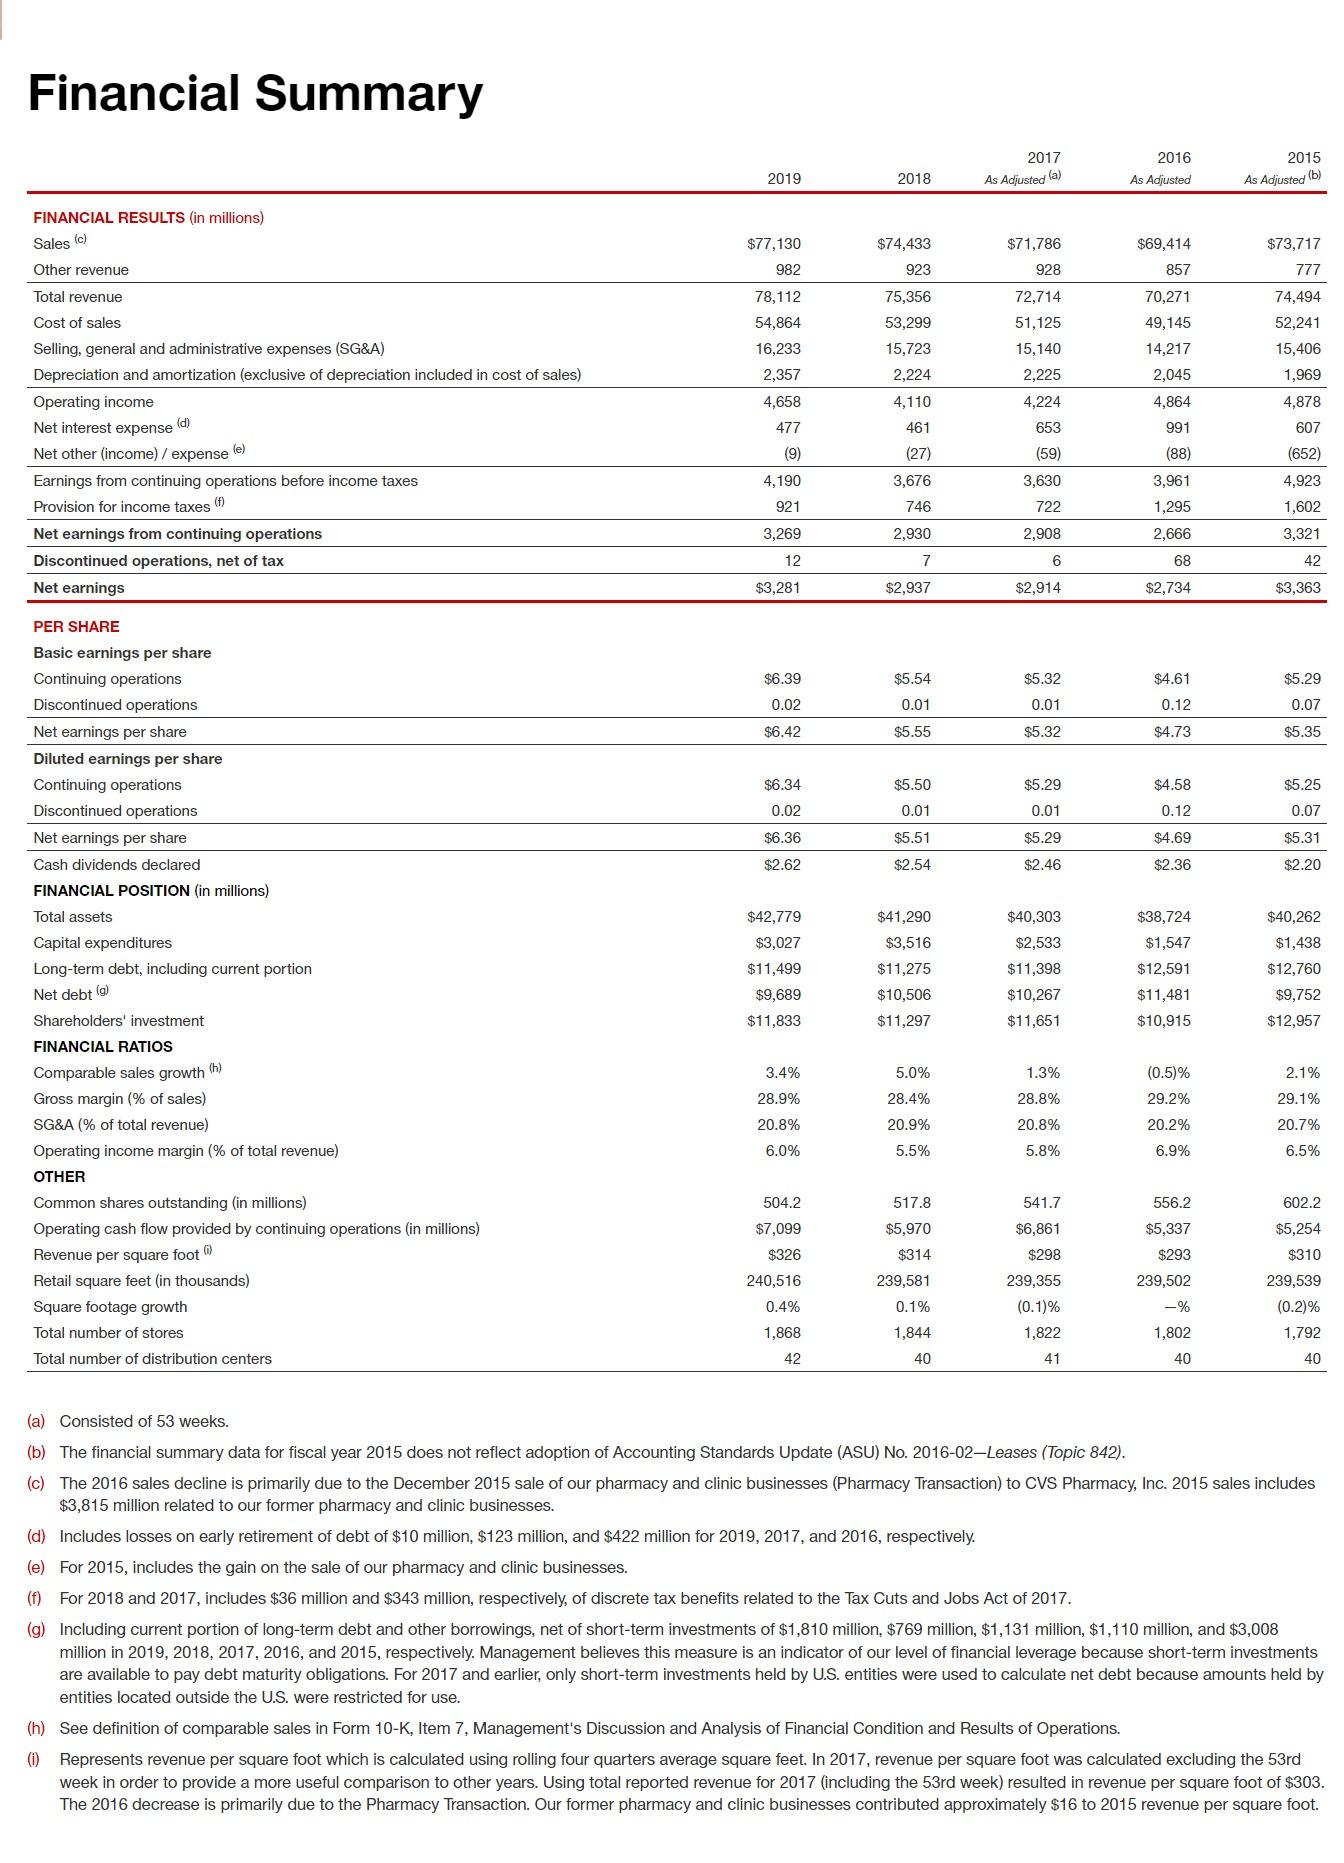
Financial Summary 2019 2018 2017 As Adjusted (a) 2016 As Adjusted 2015 As Adjusted (b) FINANCIAL RESULTS (in millions) Sales (c) Other revenue Total revenue Cost of sales $77,130 982 $74,433 923 $71,786 $69,414 $73,717 928 857 777 78,112 75,356 72,714 70,271 74,494 54,864 53,299 51,125 49,145 52,241 Selling, general and administrative expenses (SG&A) 16,233 15,723 15,140 14,217 15,406 Depreciation and amortization (exclusive of depreciation included in cost of sales) 2,357 2,224 2,225 2,045 1,969 Operating income 4,658 4,110 4,224 4,864 4,878 Net interest expense (d) 477 461 653 991 607 Net other (income) / expense (e) (9) (27) (59) (88) (652) Earnings from continuing operations before income taxes 4,190 3,676 3,630 3,961 4,923 Provision for income taxes (f) Net earnings from continuing operations Discontinued operations, net of tax Net earnings PER SHARE Basic earnings per share Continuing operations Discontinued operations Net earnings per share Diluted earnings per share Continuing operations Discontinued operations Net earnings per share 921 746 722 1,295 1,602 3,269 2,930 2,908 2,666 3,321 12 7 6 68 42 $3,281 $2,937 $2,914 $2,734 $3,363 $6.39 $5.54 $5.32 $4.61 $5.29 0.02 0.01 0.01 0.12 0.07 $6.42 $5.55 $5.32 $4.73 $5.35 $6.34 $5.50 $5.29 $4.58 $5.25 0.02 0.01 0.01 0.12 0.07 $6.36 $5.51 $5.29 $4.69 $5.31 Cash dividends declared $2.62 $2.54 $2.46 $2.36 $2.20 FINANCIAL POSITION (in millions) Total assets $42,779 $41,290 $40,303 $38,724 $40,262 Capital expenditures $3,027 $3,516 $2,533 $1,547 $1,438 Long-term debt, including current portion $11,499 $11,275 $11,398 $12,591 $12,760 Net debt (g) $9,689 $10,506 $10,267 $11,481 $9,752 Shareholders' investment $11,833 $11,297 $11,651 $10,915 $12,957 FINANCIAL RATIOS Comparable sales growth (h) Gross margin (% of sales) SG&A (% of total revenue) Operating income margin (% of total revenue) 3.4% 5.0% 1.3% (0.5)% 2.1% 28.9% 28.4% 28.8% 29.2% 29.1% 20.8% 20.9% 20.8% 20.2% 20.7% 6.0% 5.5% 5.8% 6.9% 6.5% OTHER Common shares outstanding (in millions) 504.2 517.8 541.7 556.2 602.2 Operating cash flow provided by continuing operations (in millions) $7,099 $5,970 $6,861 $5,337 $5,254 Revenue per square foot (i) $326 $314 Retail square feet (in thousands) 240,516 239,581 Square footage growth 0.4% 0.1% Total number of stores Total number of distribution centers 1,868 42 1,844 40 $298 239,355 (0.1)% 1,822 $293 239,502 -% 1,802 $310 239,539 (0.2)% 1,792 41 40 40 (a) Consisted of 53 weeks. (b) The financial summary data for fiscal year 2015 does not reflect adoption of Accounting Standards Update (ASU) No. 2016-02-Leases (Topic 842). (c) The 2016 sales decline is primarily due to the December 2015 sale of our pharmacy and clinic businesses (Pharmacy Transaction) to CVS Pharmacy, Inc. 2015 sales includes $3,815 million related to our former pharmacy and clinic businesses. (d) Includes losses on early retirement of debt of $10 million, $123 million, and $422 million for 2019, 2017, and 2016, respectively. (e) For 2015, includes the gain on the sale of our pharmacy and clinic businesses. (f) For 2018 and 2017, includes $36 million and $343 million, respectively, of discrete tax benefits related to the Tax Cuts and Jobs Act of 2017. (g) Including current portion of long-term debt and other borrowings, net of short-term investments of $1,810 million, $769 million, $1,131 million, $1,110 million, and $3,008 million in 2019, 2018, 2017, 2016, and 2015, respectively. Management believes this measure is an indicator of our level of financial leverage because short-term investments are available to pay debt maturity obligations. For 2017 and earlier, only short-term investments held by U.S. entities were used to calculate net debt because amounts held by entities located outside the U.S. were restricted for use. (i) (h) See definition of comparable sales in Form 10-K, Item 7, Management's Discussion and Analysis of Financial Condition and Results of Operations. Represents revenue per square foot which is calculated using rolling four quarters average square feet. In 2017, revenue per square foot was calculated excluding the 53rd week in order to provide a more useful comparison to other years. Using total reported revenue for 2017 (including the 53rd week) resulted in revenue per square foot of $303. The 2016 decrease is primarily due to the Pharmacy Transaction. Our former pharmacy and clinic businesses contributed approximately $16 to 2015 revenue per square foot.
Step by Step Solution
There are 3 Steps involved in it

Get step-by-step solutions from verified subject matter experts