

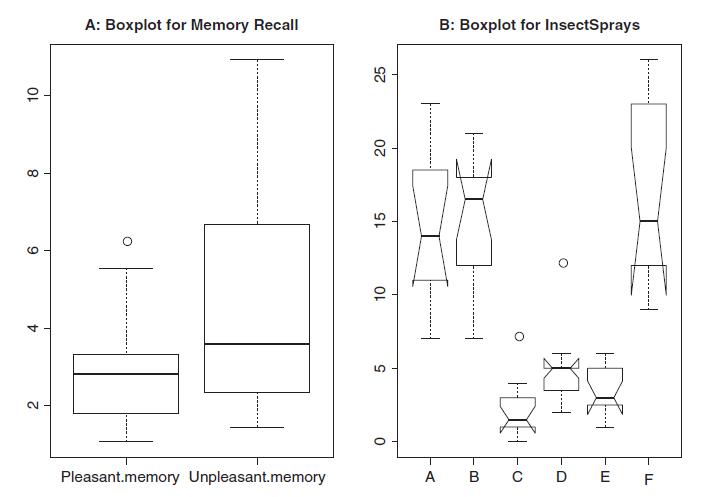
The part B of Figure 4.4, see Example 4.5, clearly shows the presence of outliers for the
Question:
The part B of Figure 4.4, see Example 4.5, clearly shows the presence of outliers for the number of dead insects for insecticides C and D. Identify the outlying data points. Remove the outlying points, and then check if any more potential outliers are present.
Data from in Figure 4.4
Data from in Example 4.5
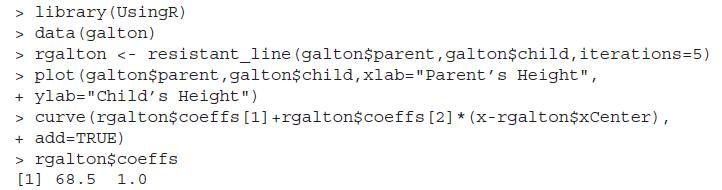
This dataset was used earlier as an example of an x-y plot. The scatter plot of the parents and the child reflected weak correlation in Figure 4.11, and now we examine and estimate the effect by using the resistant line model. The function resistant_line from the companion package will be used to build the model 4.11.
Fantastic news! We've Found the answer you've been seeking!
Step by Step Answer:
Answer The outlying data points for insecticides C and ...View the full answer

Answered By
Justin Akengo
I am writing in application for the tutor position with your organisation. I am experienced in tutoring students of all abilities and I believe I am the ideal candidate for this position.
I work with students of all ages, from elementary school to college level. Whether the subject is science, Mathematics or basic study skills, I break material down into easy-to-understand concepts. In your job posting, you asked for someone who can tutor in a variety of subjects. I am comfortable explaining calculus to a college student or working with a kindergartener on spelling fundamentals.
Below are just a few core skills and qualifications I posses as a tutor;
Adept at creating study materials in a variety of academic subjects to help students improve their test scores and GPAs.
Strong interpersonal skills in working with students to help them achieve and succeed.
Have written study books adopted by a high school and a college to help students improve their skills in English and mathematics.
Have won several “Tutor of the Year” awards for work with high school and college students.
0 Reviews
10+ Question Solved
Related Book For 
A Course In Statistics With R
ISBN: 9781119152729
1st Edition
Authors: Prabhanjan N. Tattar, Suresh Ramaiah, B. G. Manjunath
Question Posted:
