

Question: Given the following control chart, which problem is most likely? X-Bar Chart of Sample Means (44 centerline crossings) 2010 2005 2000 1995 .....UCL +2
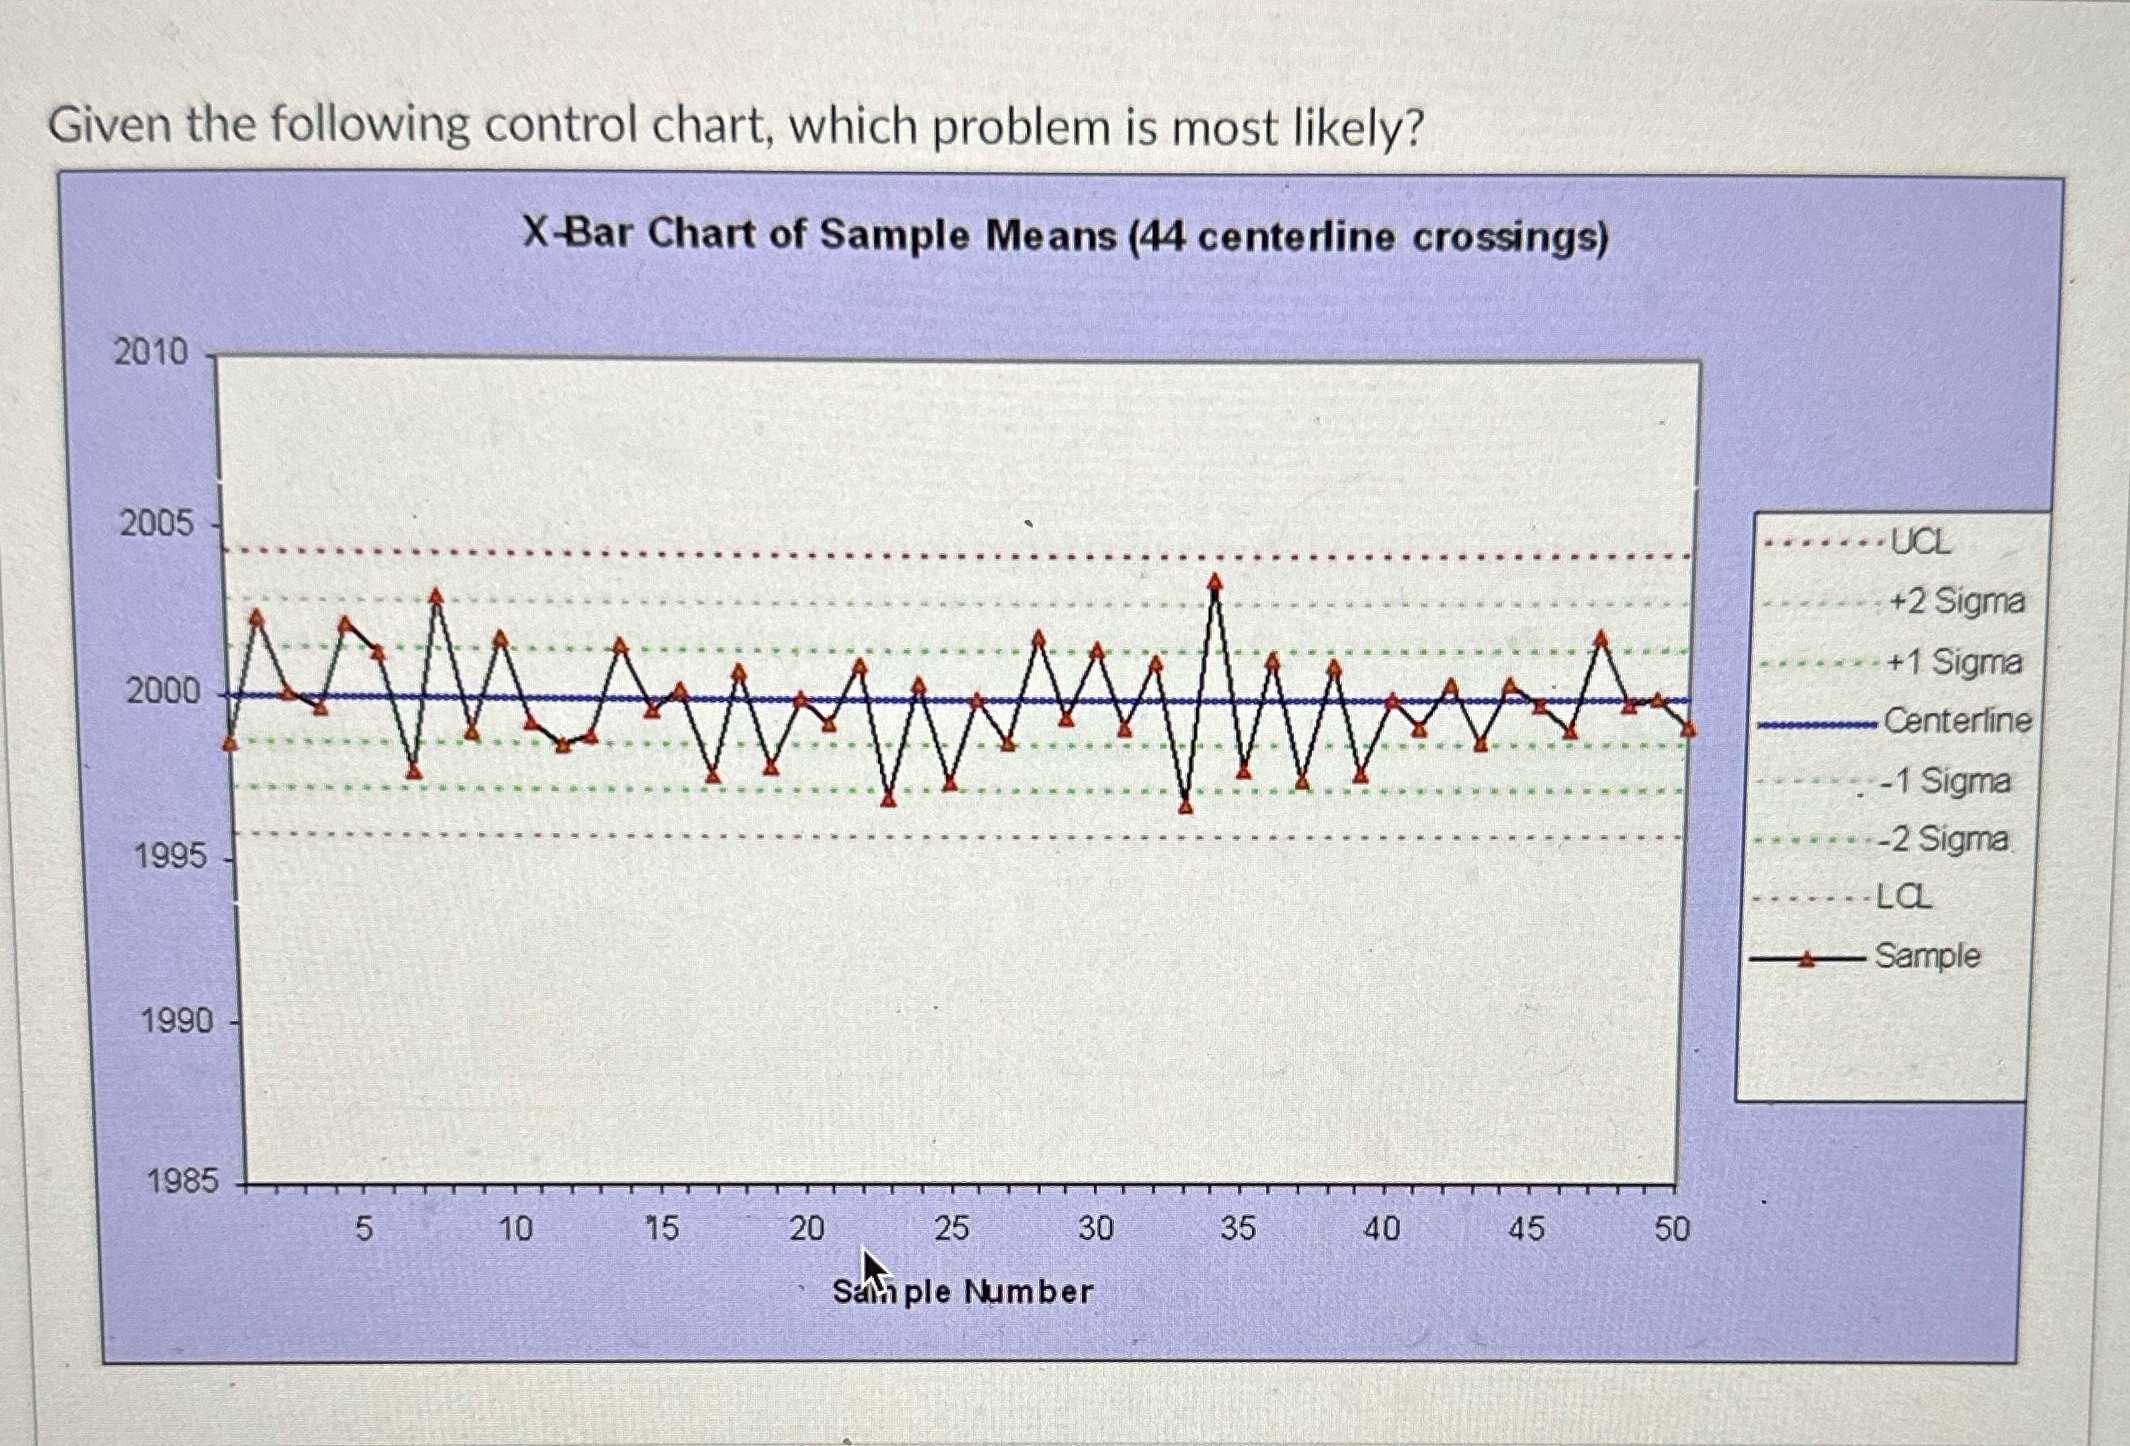
Given the following control chart, which problem is most likely? X-Bar Chart of Sample Means (44 centerline crossings) 2010 2005 2000 1995 .....UCL +2 Sigma M +1 Sigma . Centerline -1 Sigma wwwwwwwwww -2 Sigma 1990 1985 5 10 10 15 20 20 25 30 Sample Number 35 40 40 45 55 50 50 La Sample
Step by Step Solution
There are 3 Steps involved in it
1 Expert Approved Answer
Step: 1 Unlock

Question Has Been Solved by an Expert!
Get step-by-step solutions from verified subject matter experts
Step: 2 Unlock
Step: 3 Unlock