

Question: Given the following data on inputs and outputs at a work center, determine the cumulative deviation and the backlog for each time period. The beginning
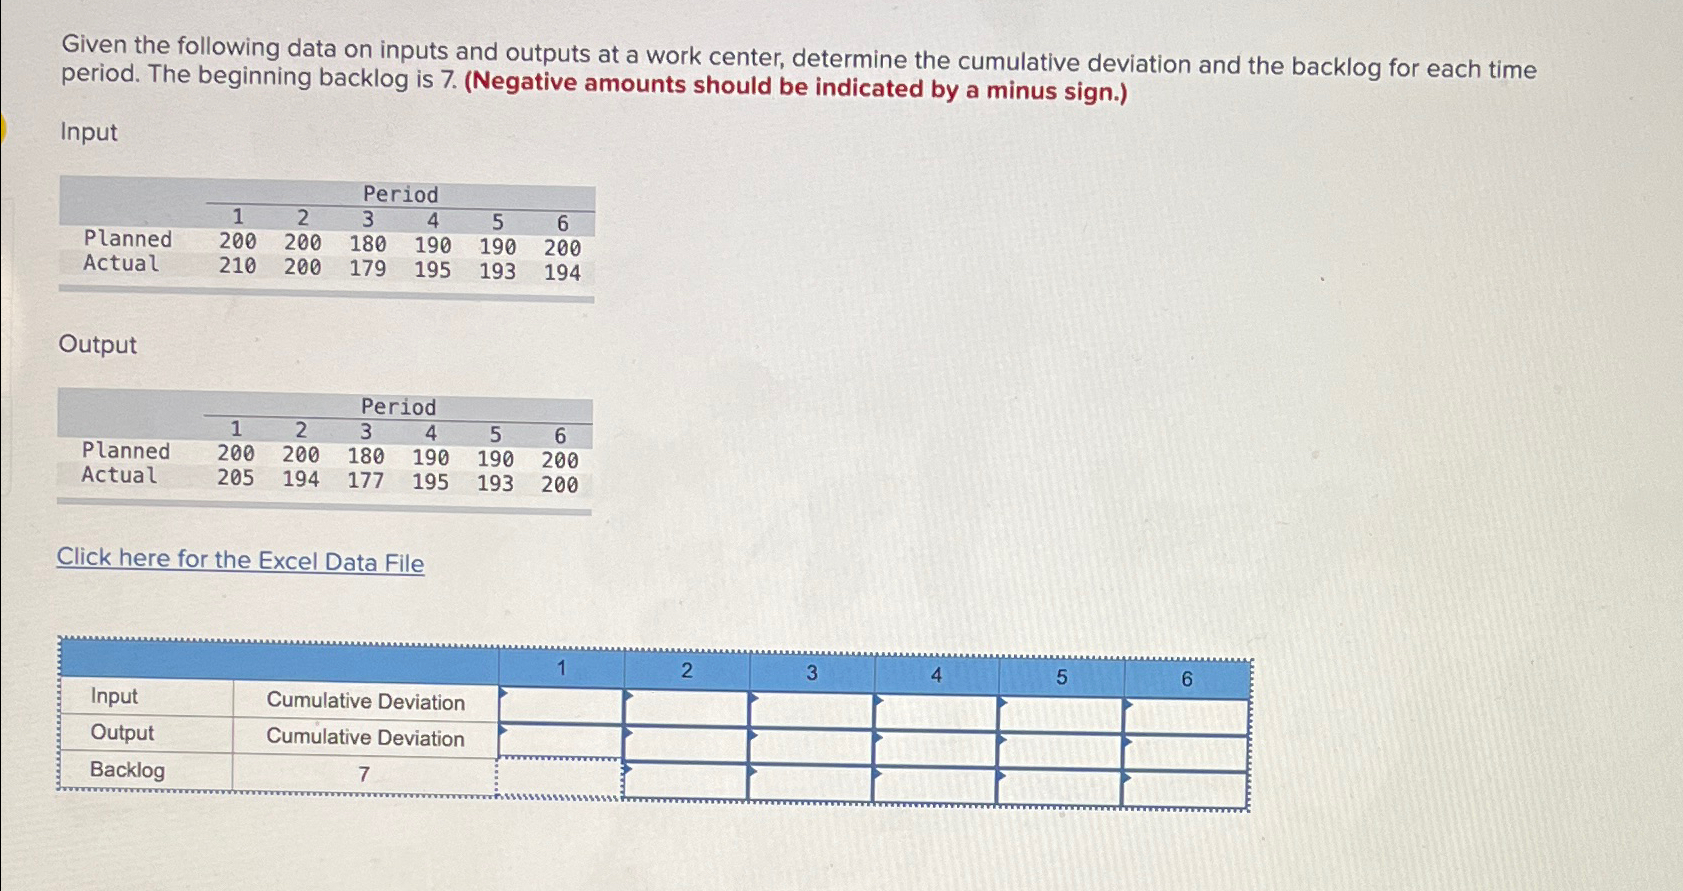
Given the following data on inputs and outputs at a work center, determine the cumulative deviation and the backlog for each time period. The beginning backlog is Negative amounts should be indicated by a minus sign.
Input
tablePeriodPlannedActual
Output
tablePeriodPlannedActual
Click here for the Excel Data File
tableInputCumulative Deviation,,,,,OutputCumulative Deviation,,,,,Backlog
Step by Step Solution
There are 3 Steps involved in it
1 Expert Approved Answer
Step: 1 Unlock

Question Has Been Solved by an Expert!
Get step-by-step solutions from verified subject matter experts
Step: 2 Unlock
Step: 3 Unlock