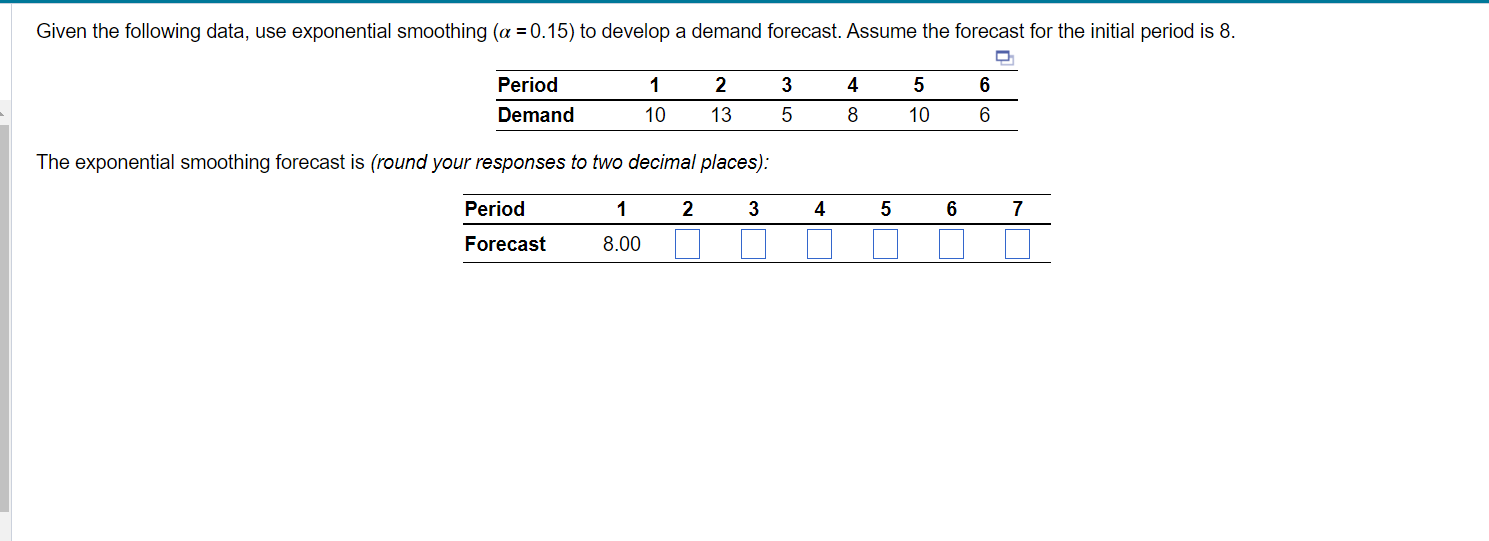
Question: Given the following data, use exponential smoothing (a = 0.15) to develop a demand forecast. Assume the forecast for the initial period is 8. El
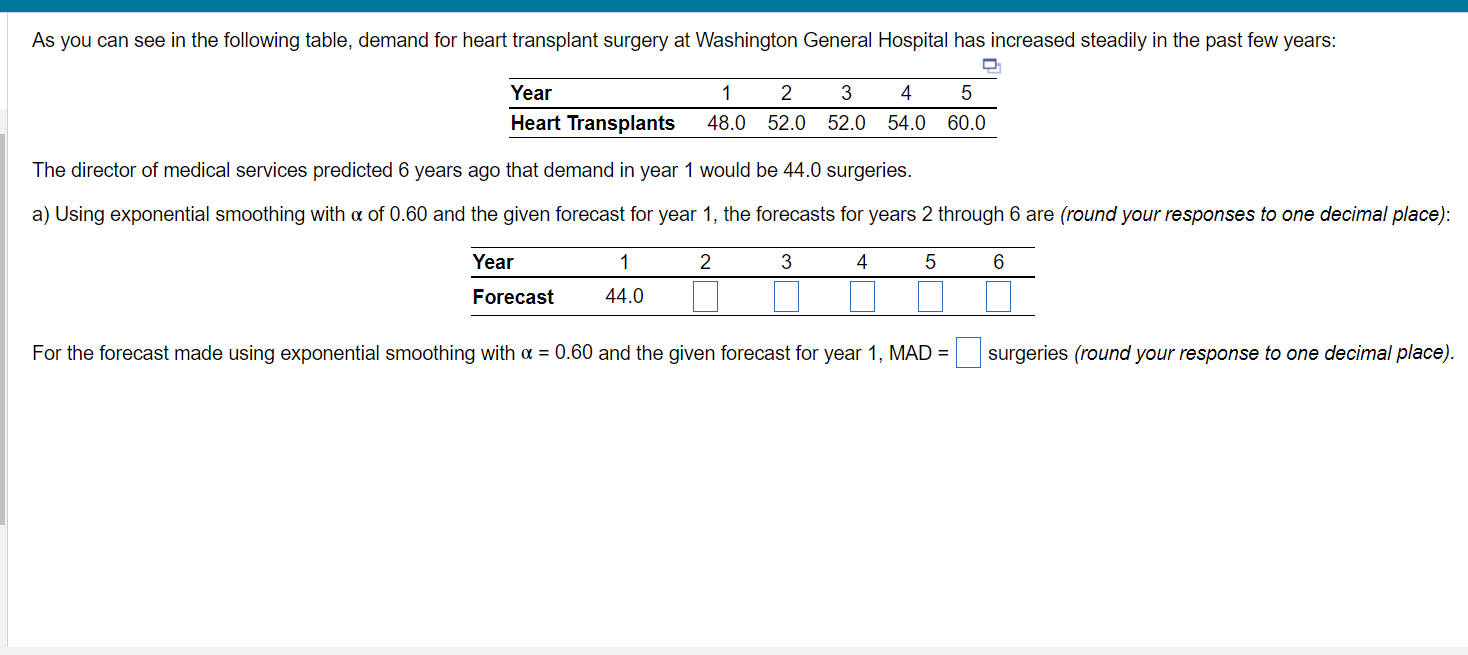
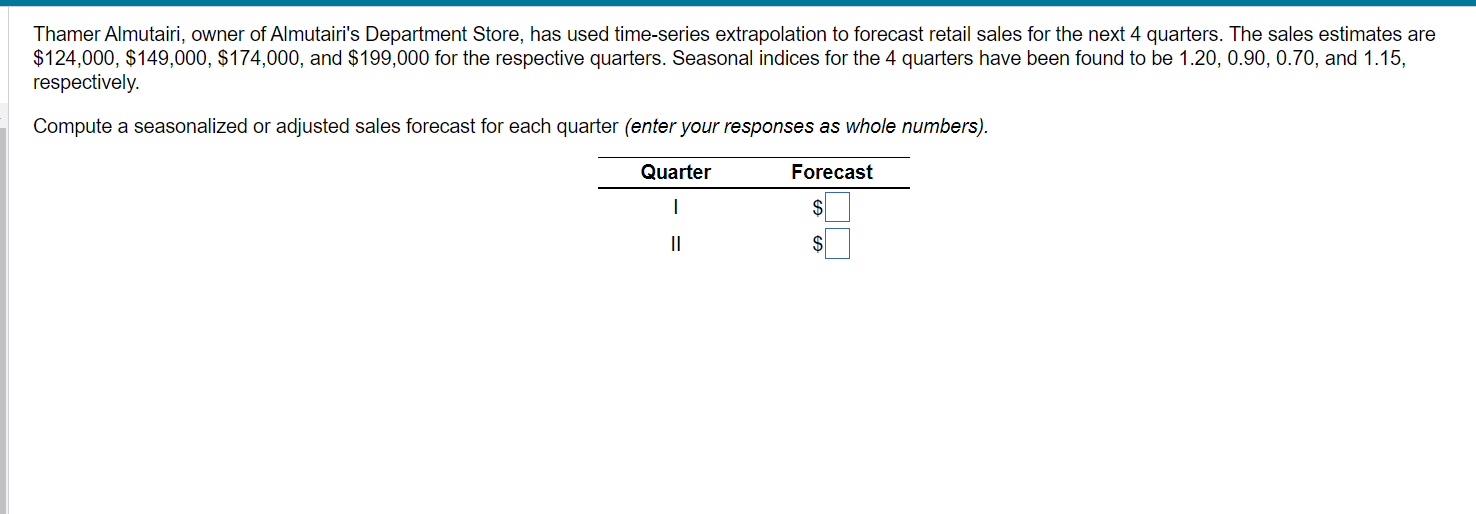
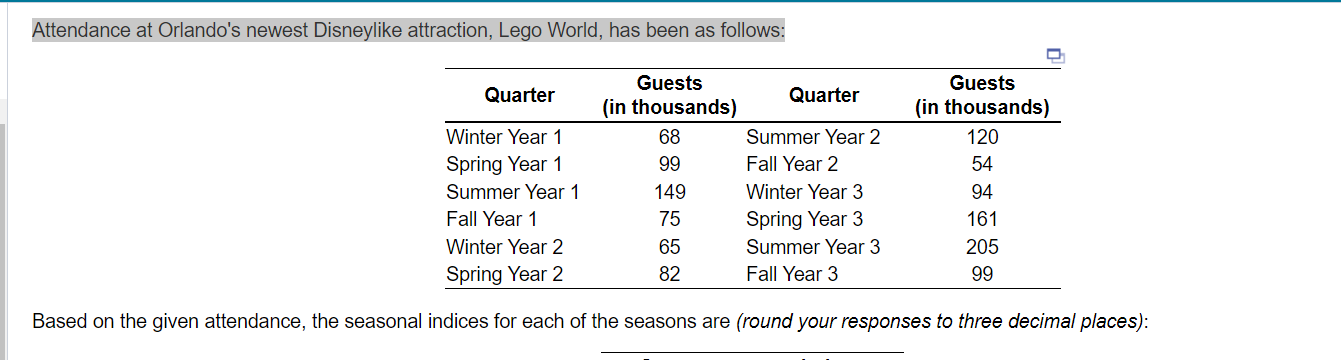
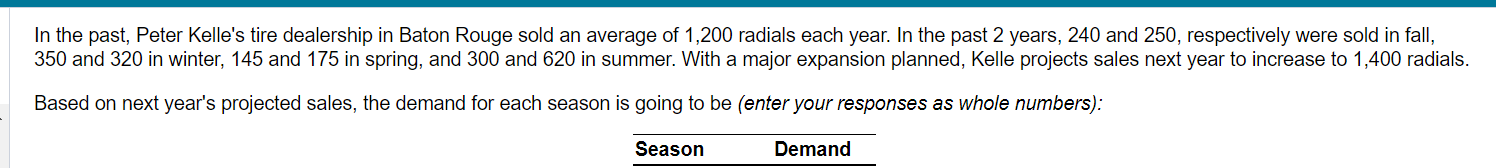
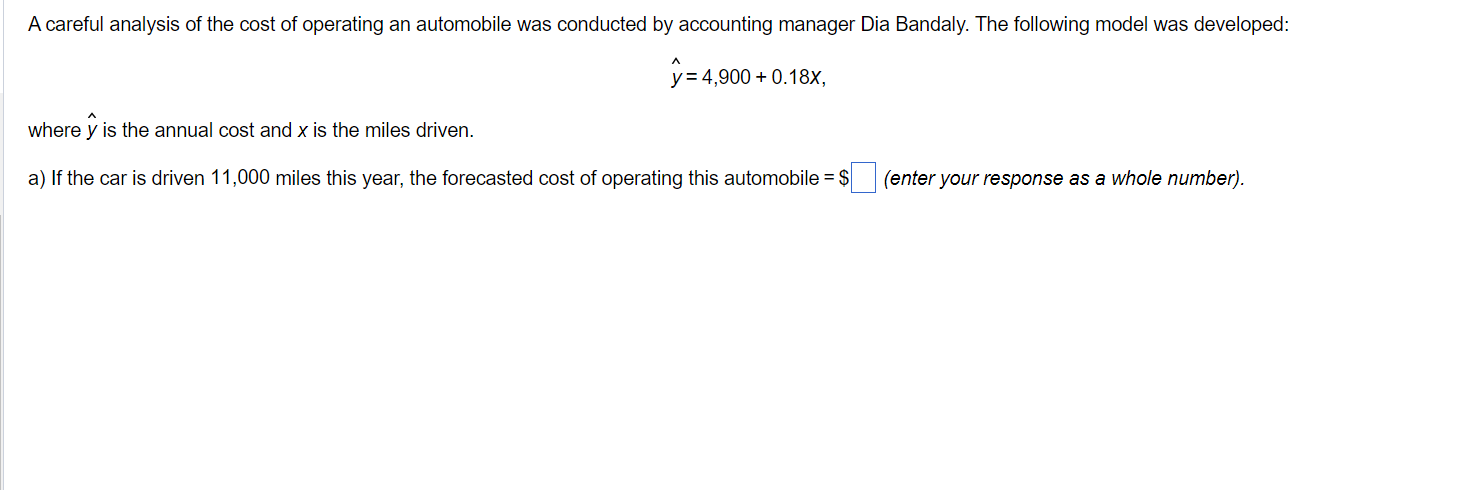
Given the following data, use exponential smoothing (a = 0.15) to develop a demand forecast. Assume the forecast for the initial period is 8. El Period 1 2 3 4 5 6 Demand 10 13 5 8 10 6 The exponential smoothing forecast is {round your responses to two decimal places): Period 1 2 3 4 5 6 7 Forecast 8.00 As you can see in the following table, demand for heart transplant surgery at Washington General Hospital has increased steadily in the past few years: El Year 1 2 3 4 5 HeartTransplants 48.0 52.0 52.0 54.0 60.0 The director of medical services predicted 6 years ago that demand in year 1 would be 44.0 surgeries. a) Using exponential smoothing with o: of 0.60 and the given forecast for year 1, the forecasts for years 2 through 6 are (round your responses to one decimal place): Year 1 2 3 4 5 6 Forecast 44. 0 For the forecast made using exponential smoothing with a = 0.60 and the given forecast for year 1, MAD = surgeries (round your response to one decimal place). Thamer Almutairi, owner of Almutairi's Department Store, has used time-series extrapolation to forecast retail sales for the next 4 quarters. The sales estimates are $124,000, $149,000, $174,000, and $199,000 for the respective quarters. Seasonal indices for the 4 quarters have been found to be 1.20, 0.90, 0.70, and 1.15, respectively. Compute a seasonalized or adjusted sales forecast for each quarter (enter your responses as whole numbers). Quarter Forecast | $ I I $ Attendance at Orlando's newest Disneylike attraction, Lego World, has been as follows: Ci Guests Guests Quarter (in thousands] Quarter (in thousands) Winter Year 1 68 Summer Year 2 120 Spring Year 1 99 Fall Year 2 54 Summer Year 1 149 Winter Year 3 94 Fall Year 1 75 Spring Year 3 161 Winter Year 2 65 Summer Year 3 205 Spring Year 2 82 Fall Year 3 99 Based on the given attendance, the seasonal indices for each of the seasons are (round your responses to three decimai pieces): In the past, Peter Kelle's tire dealership in Baton Rouge sold an average of 1,200 radials each year. In the past 2 years, 240 and 250, respectively were sold in tall, 350 and 320 in winter, 145 and 175 in spring, and 300 and 620 in summer. With a major expansion planned, Kelle projects sales next yearto increase to 1,400 radials. Based on next year's projected sales, the demand for each season is going to be {enter your responses as whole numbers): Season Demand A careful analysis of the cost of operating an automobile was conducted by accounting manager Dia Bandaly. The following model was developed: 9:4,900 + max, where y is the annual cost and x is the miles driven. a) If the car is driven 11,000 miles this year, the forecasted cost of operating this automobile = 3 (enter your response as a whole number)
Step by Step Solution
There are 3 Steps involved in it
1 Expert Approved Answer
Step: 1 Unlock
Question Has Been Solved by an Expert!
Get step-by-step solutions from verified subject matter experts
Step: 2 Unlock
Step: 3 Unlock
Students Have Also Explored These Related Mathematics Questions!