

Question: Given the following data, use least - squares regression to derive a trend equation: table [ [ Period , 1 , 2 , 3
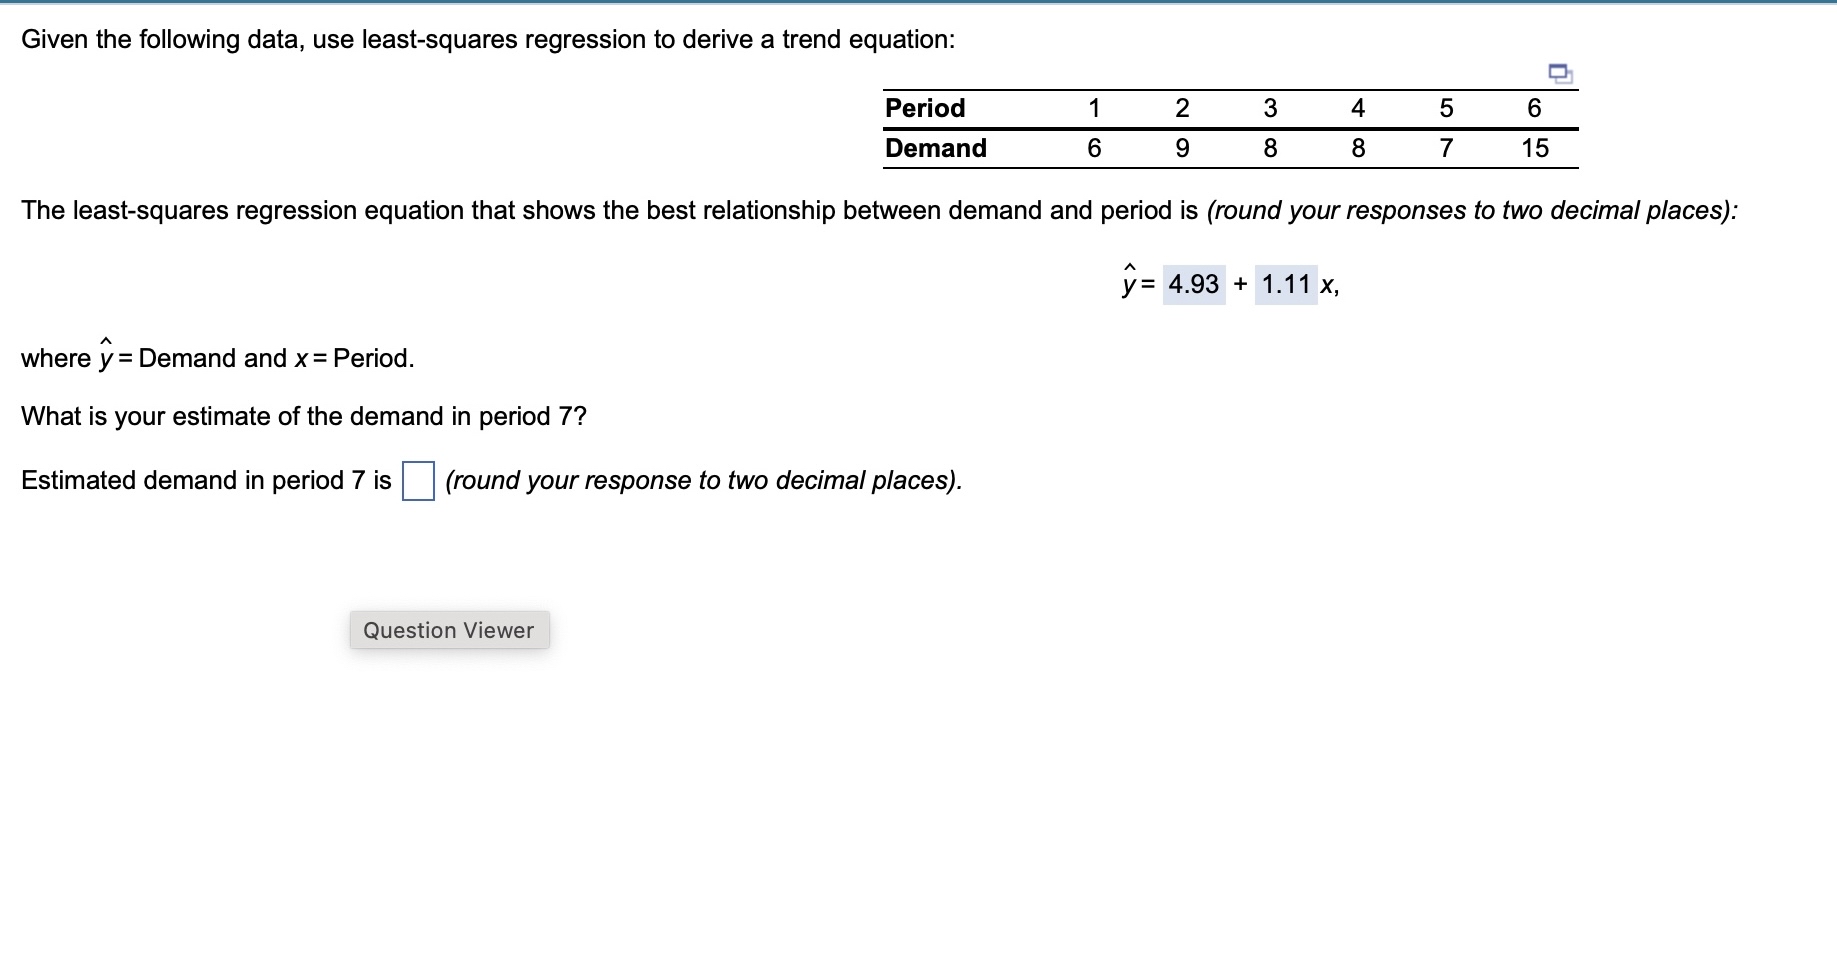
Given the following data, use leastsquares regression to derive a trend equation:
tablePeriodDemand
The leastsquares regression equation that shows the best relationship between demand and period is round your responses to two decimal places:
hat
where hat Demand and Period.
What is your estimate of the demand in period
Estimated demand in period is round your response to two decimal places
Step by Step Solution
There are 3 Steps involved in it
1 Expert Approved Answer
Step: 1 Unlock

Question Has Been Solved by an Expert!
Get step-by-step solutions from verified subject matter experts
Step: 2 Unlock
Step: 3 Unlock