

Question: Given the following data xo = 0 f(x0) = 0 xi-1 f(x) 11 x2 = 4 f(x2) = 19 x3-9 f(x3)=19 Write C code that
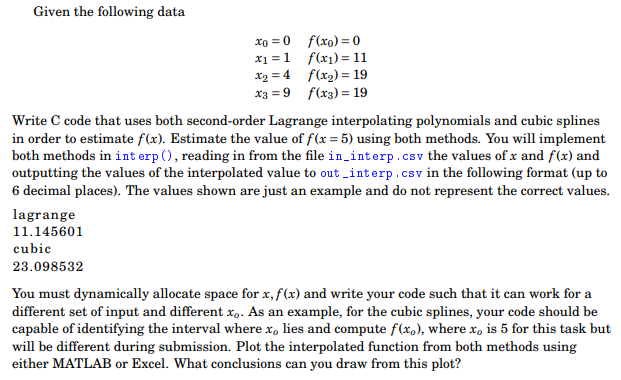
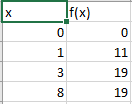
Given the following data xo = 0 f(x0) = 0 xi-1 f(x) 11 x2 = 4 f(x2) = 19 x3-9 f(x3)=19 Write C code that uses both second-order Lagrange interpolating polynomials and cubic splines in order to estimate f(x). Estimate the value of f(x5) using both methods. You will implement both methods in int erp ), reading in from the file in_interp .csv the values of x and f(x) and outputting the values of the interpolated value to out.interp.csv in the following format (up to 6 decimal places). The values shown are just an example and do not represent the correct values lagrange 11.145601 cubic 23.098532 You must dynamically allocate space for x, f(x) and write your code such that it can work for a different set of input and different xo. As an example, for the cubic splines, your code should be capable of identifying the interval where xo lies and compute f(xo), where xo is 5 for this task but will be different during submission. Plot the interpolated function from both methods using either MATLAB or Excel. What conclusions can you draw from this plot? Given the following data xo = 0 f(x0) = 0 xi-1 f(x) 11 x2 = 4 f(x2) = 19 x3-9 f(x3)=19 Write C code that uses both second-order Lagrange interpolating polynomials and cubic splines in order to estimate f(x). Estimate the value of f(x5) using both methods. You will implement both methods in int erp ), reading in from the file in_interp .csv the values of x and f(x) and outputting the values of the interpolated value to out.interp.csv in the following format (up to 6 decimal places). The values shown are just an example and do not represent the correct values lagrange 11.145601 cubic 23.098532 You must dynamically allocate space for x, f(x) and write your code such that it can work for a different set of input and different xo. As an example, for the cubic splines, your code should be capable of identifying the interval where xo lies and compute f(xo), where xo is 5 for this task but will be different during submission. Plot the interpolated function from both methods using either MATLAB or Excel. What conclusions can you draw from this plot
Step by Step Solution
There are 3 Steps involved in it

Get step-by-step solutions from verified subject matter experts