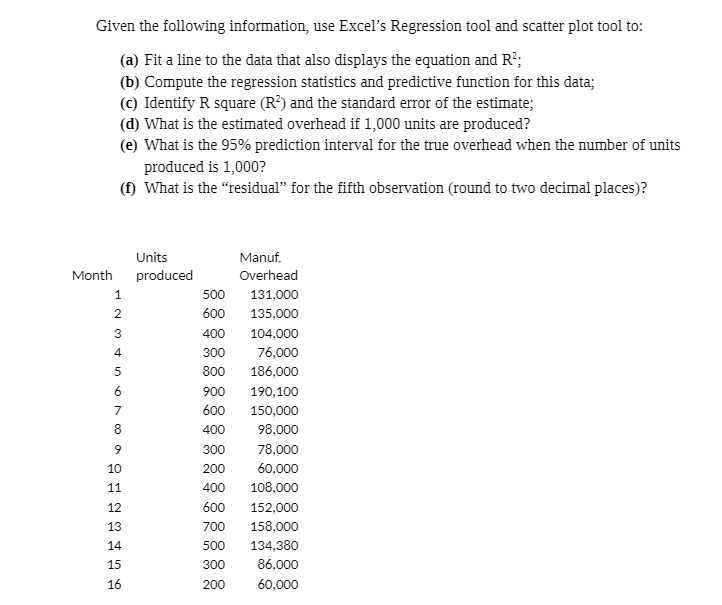
Question: Given the following information, use Excel's Regression tool and scatter plot tool to: {a} Fit a ne to the data that also displays the equation

Given the following information, use Excel's
Given the following information, use Excel's Regression tool and scatter plot tool to: {a} Fit a ne to the data that also displays the equation and R2; {Ii} Compute the regression statistics and predictive function for this data; {[3 Identity R square {R2} and the standard error of the estimate; {d} What is the estimated overhead it 1,000 units are produced? {e} What is the 05% prediction interval for the true overhead when the number of units produced is 1,000? {f} What is the \"residual" for the fth observation {round to two decimal places}? Units Man uf. Month produced Overhead 1 500 131,000 2 500 135,000 3 4134:) 104,000 4 300 306,000 5 300 136,000 {a I5"00 190,100 I" 600 150,000 a 4oo vaooo 9 300 ?'3,000 10 200 50,000 11 400 103,000 12 500 152,000 13 0'00 153,000 14 500 134,350 15 300 36,000 0 ,3

Step by Step Solution

There are 3 Steps involved in it

1 Expert Approved Answer
Step: 1 Unlock blur-text-image
Question Has Been Solved by an Expert!

Get step-by-step solutions from verified subject matter experts

Step: 2 Unlock
Step: 3 Unlock

Students Have Also Explored These Related Accounting Questions!