

Question: please show step by step how to solve this using excel Given the following information, use Excel's Regression tool and scatter plot tool to: (a)
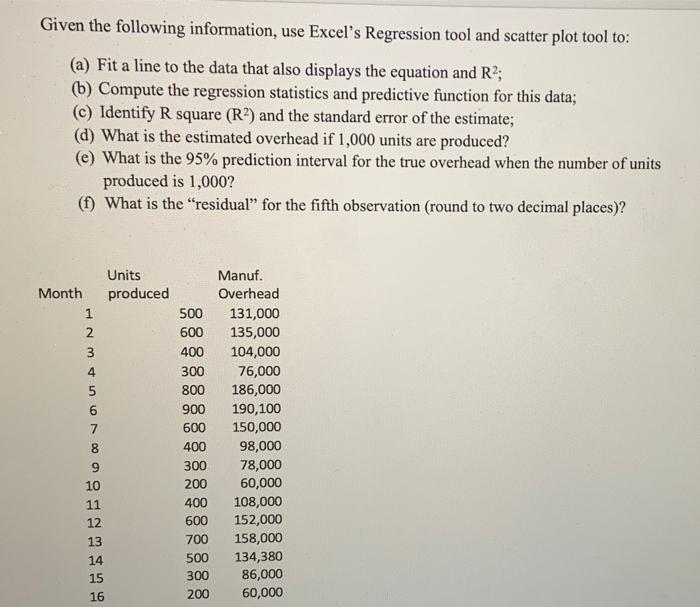
Given the following information, use Excel's Regression tool and scatter plot tool to: (a) Fit a line to the data that also displays the equation and R2; (b) Compute the regression statistics and predictive function for this data; (c) Identify R square (R2) and the standard error of the estimate; (d) What is the estimated overhead if 1,000 units are produced? (e) What is the 95% prediction interval for the true overhead when the number of units produced is 1,000? (f) What is the "residual for the fifth observation (round to two decimal places)? Month Units produced URBO OWN 500 600 400 300 800 900 600 400 300 200 400 600 700 500 300 200 Manuf. Overhead 131,000 135,000 104,000 76,000 186,000 190,100 150,000 98,000 78,000 60,000 108,000 152,000 158,000 134,380 86,000 60,000 10 11 12 13 14 15 16
Step by Step Solution
There are 3 Steps involved in it

Get step-by-step solutions from verified subject matter experts