

Question: Given the following price and quantity - supplied data, graph this firm's supply curve on the axis provided. Also, for each price and quantity -
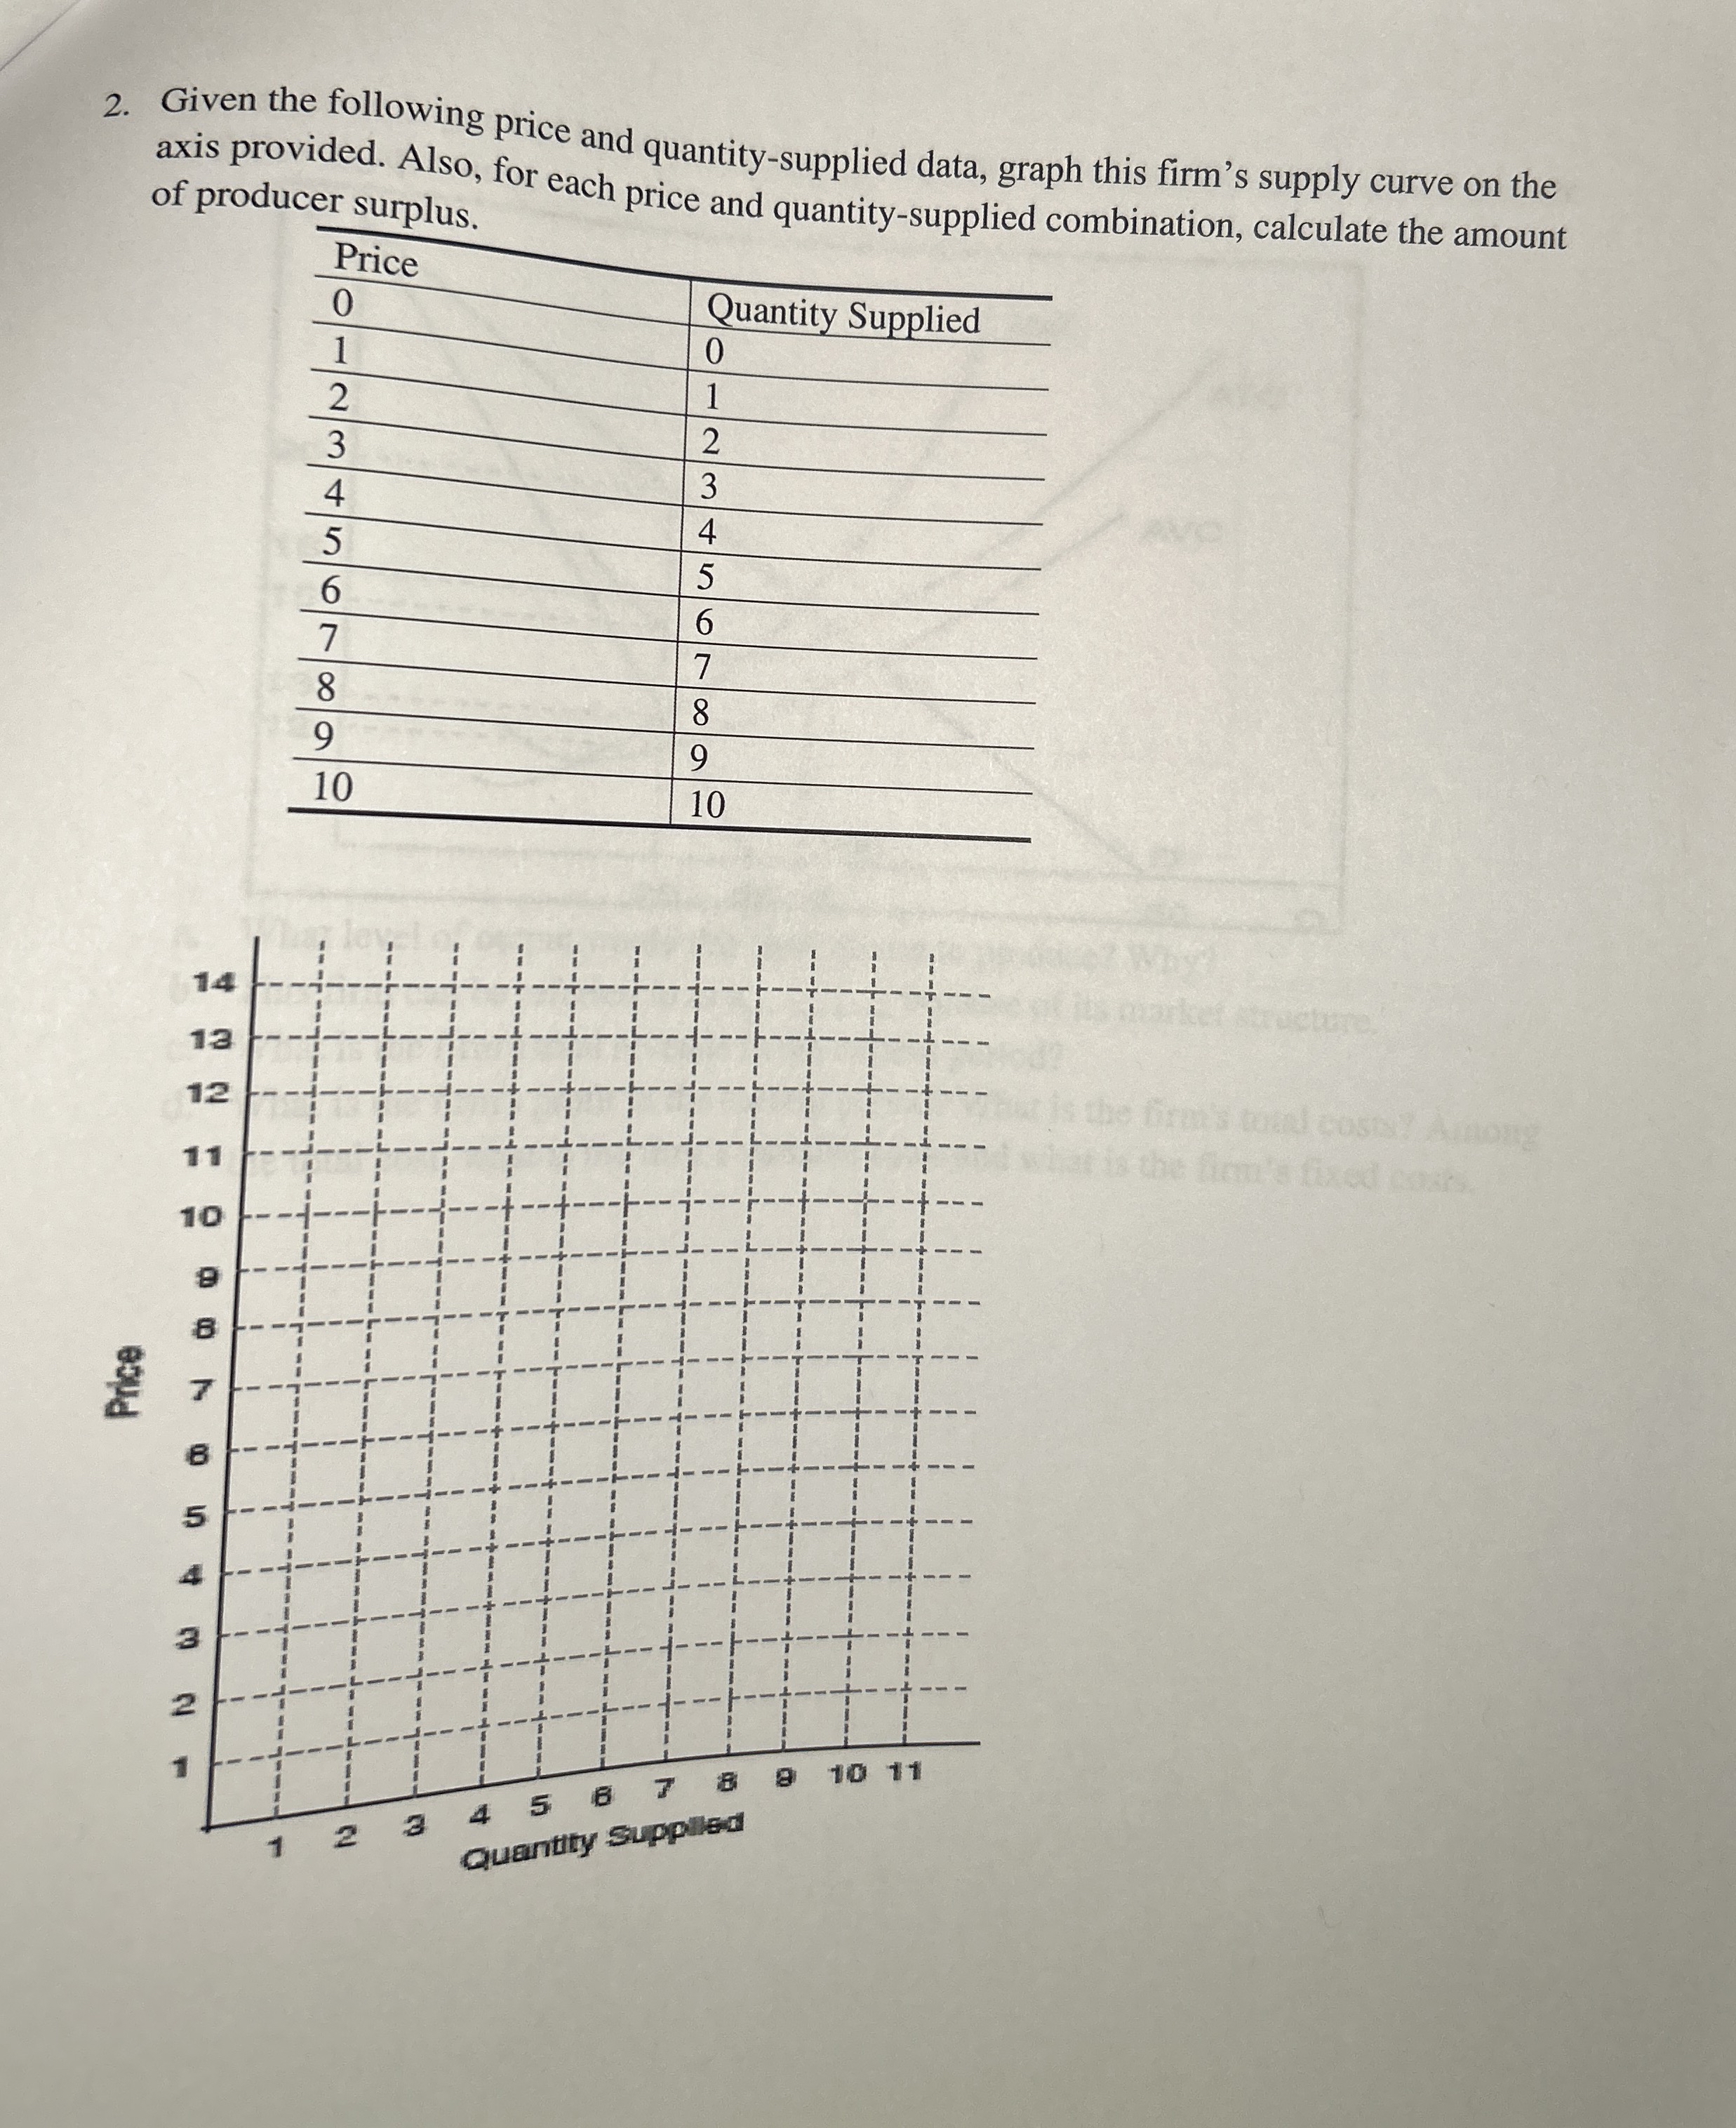
Given the following price and quantitysupplied data, graph this firm's supply curve on the axis provided. Also, for each price and quantitysupplied combination, calculate the amount of producer surplus.
tablePriceQuantity Supplied
Step by Step Solution
There are 3 Steps involved in it
1 Expert Approved Answer
Step: 1 Unlock

Question Has Been Solved by an Expert!
Get step-by-step solutions from verified subject matter experts
Step: 2 Unlock
Step: 3 Unlock