

Question: Given the following process control data for a normally distributed quality variable (three samples of size four each): If the process is known to have
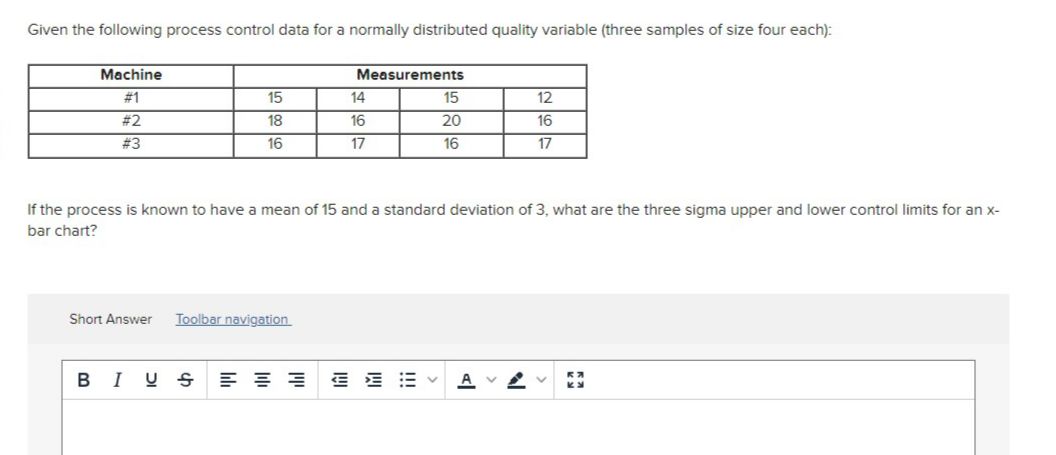
Given the following process control data for a normally distributed quality variable (three samples of size four each): If the process is known to have a mean of 15 and a standard deviation of 3 , what are the three sigma upper and lower control limits for an x bar chart? Given the following process control data for a normally distributed quality variable (three samples of size four each): If the process is known to have a mean of 15 and a standard deviation of 3 , what are the three sigma upper and lower control limits for an x bar chart
Step by Step Solution
There are 3 Steps involved in it
1 Expert Approved Answer
Step: 1 Unlock

Question Has Been Solved by an Expert!
Get step-by-step solutions from verified subject matter experts
Step: 2 Unlock
Step: 3 Unlock