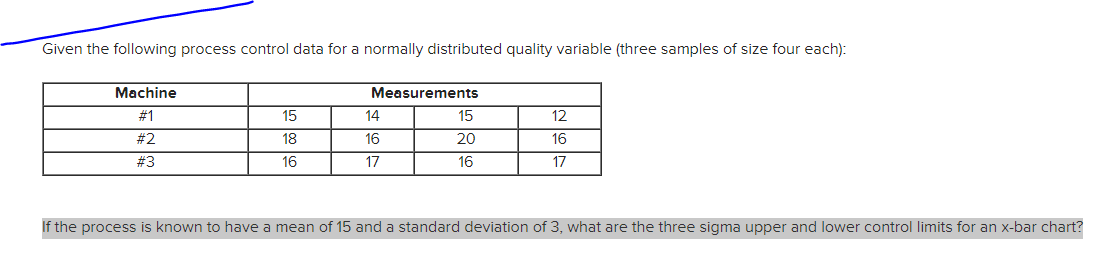
Question: Given the following process control data for a normally distributed quality variable (three samples of size four each): Machine #1 Measurements 14 15 15 12

Given the following process control data for a

Given the following process control data for a normally distributed quality variable (three samples of size four each): Machine #1 Measurements 14 15 15 12 16 #2 16 20 18 16 #3 17 16 17 If the process is known to have a mean of 15 and a standard deviation of 3, what are the three sigma upper and lower control limits for an x-bar chart

Step by Step Solution

There are 3 Steps involved in it

1 Expert Approved Answer
Step: 1 Unlock blur-text-image
Question Has Been Solved by an Expert!

Get step-by-step solutions from verified subject matter experts

Step: 2 Unlock
Step: 3 Unlock

Students Have Also Explored These Related General Management Questions!