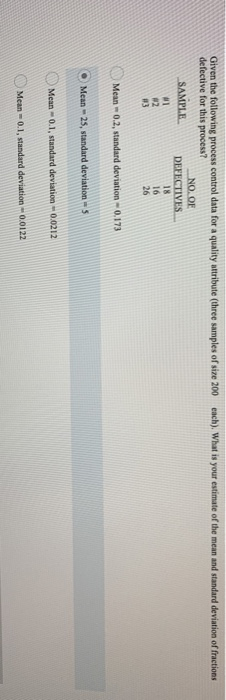
Question: Given the following process control data for a quality attribute three samples of size 200 each). What is your estimate of the mean and standard

Given the following process control data for a
Given the following process control data for a quality attribute three samples of size 200 each). What is your estimate of the mean and standard deviation of fractions defective for this process? NO. OF SAMPLE DEFECTIVES 1 18 16 #3 26 Mean -0.2, standard deviation-0.173 Mean - 25, standard deviation Mean - 0.1, standard deviation-0.0212 Mean-0.1, standard deviation-0.0122 When control charts are used, what type of error occurs when it is concluded that a process is in control (i.c., stable, consistent) when actually it is not? U 0.5 po Type I error Non-Random error Assignable error Type 2 error

Step by Step Solution

There are 3 Steps involved in it

1 Expert Approved Answer
Step: 1 Unlock blur-text-image
Question Has Been Solved by an Expert!

Get step-by-step solutions from verified subject matter experts

Step: 2 Unlock
Step: 3 Unlock

Students Have Also Explored These Related General Management Questions!