

Question: Given the following regression equations, what would a plot of the regression line look like on a scatterplot? That is, what would the regression line
Given the following regression equations, what would a plot of the regression line look like on a scatterplot? That is, what would the regression line look like if drawing one like the following figure ?
y = 0.5 + 5x
Options: downwardegative straight line
upward/positive straight line
upward/positive curved line
downwardegative curved line
horizontal/flat straight line
y = 5 - 8x
Options: downwardegative straight line
upward/positive straight line
upward/positive curved line
downwardegative curved line
horizontal/flat straight line
y = 10 + 0x
Options: downwardegative straight line
upward/positive straight line
upward/positive curved line
downwardegative curved line
horizontal/flat straight line
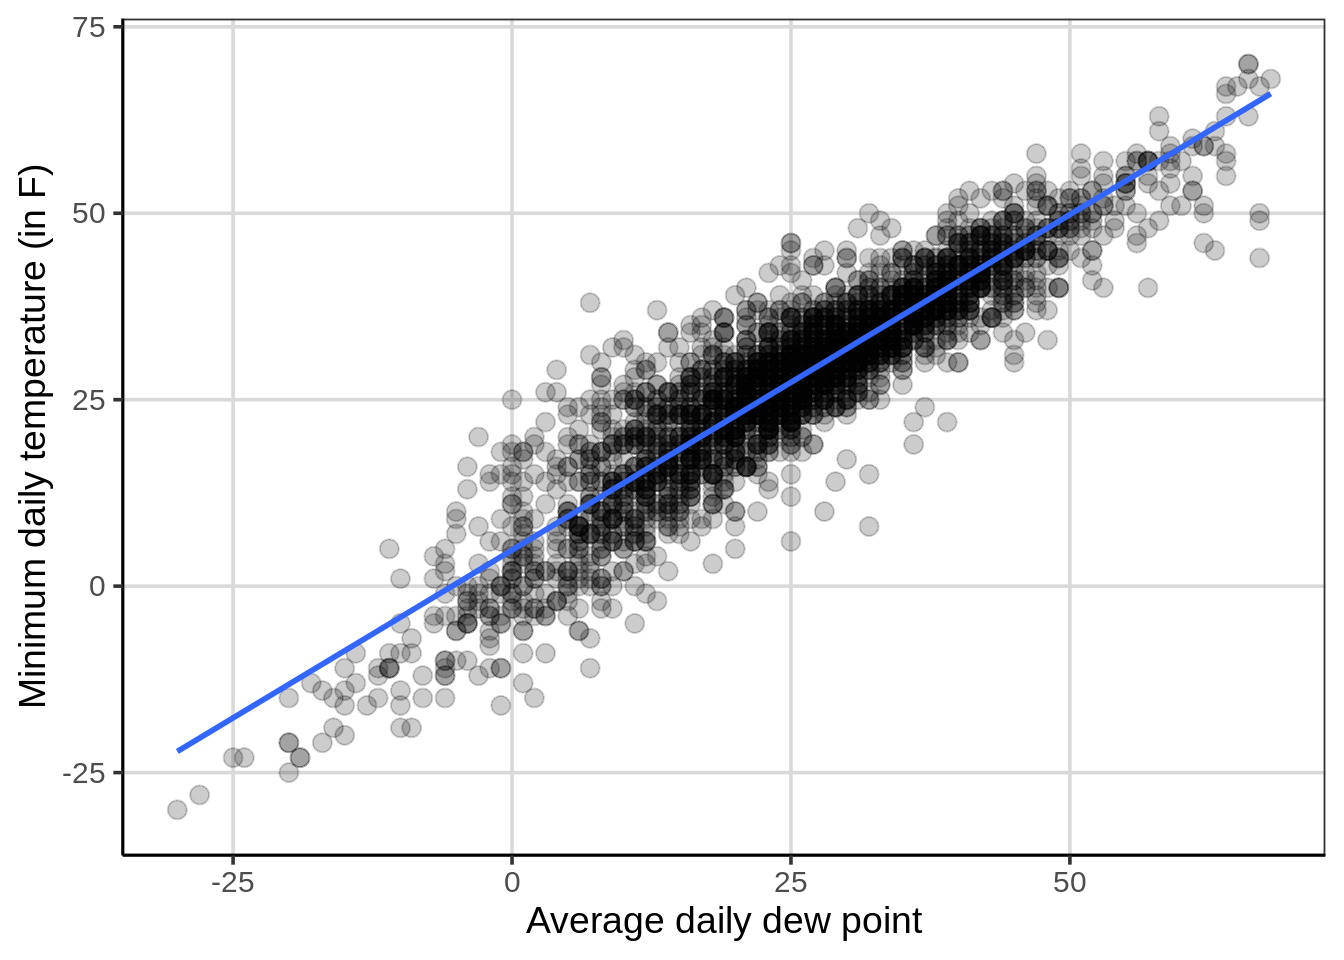
75 50 - 25 Minimum daily temperature (in F) 0 . -25 -25 0 25 50 Average daily dew point
Step by Step Solution
There are 3 Steps involved in it

Get step-by-step solutions from verified subject matter experts