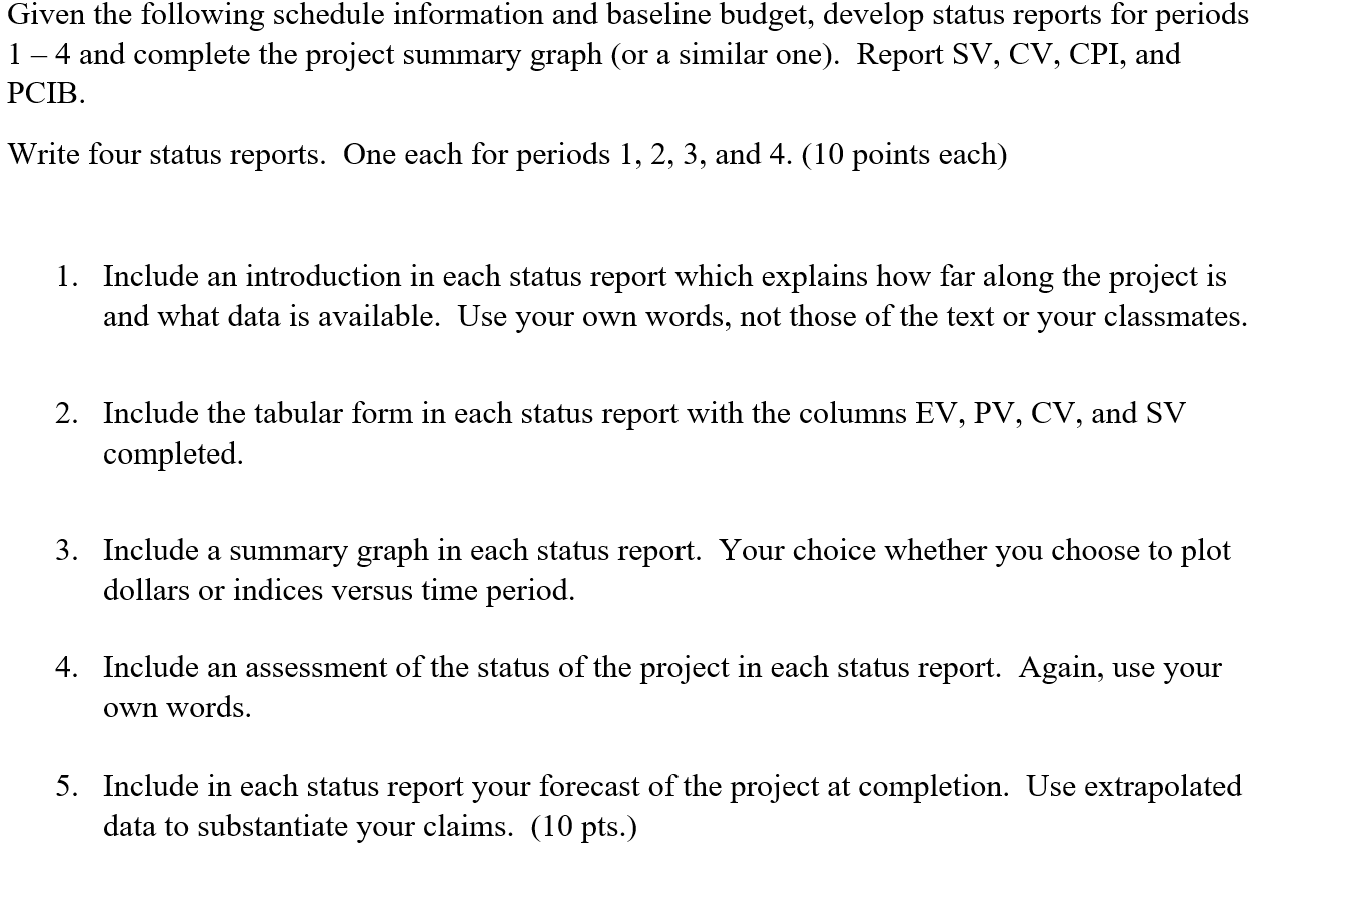
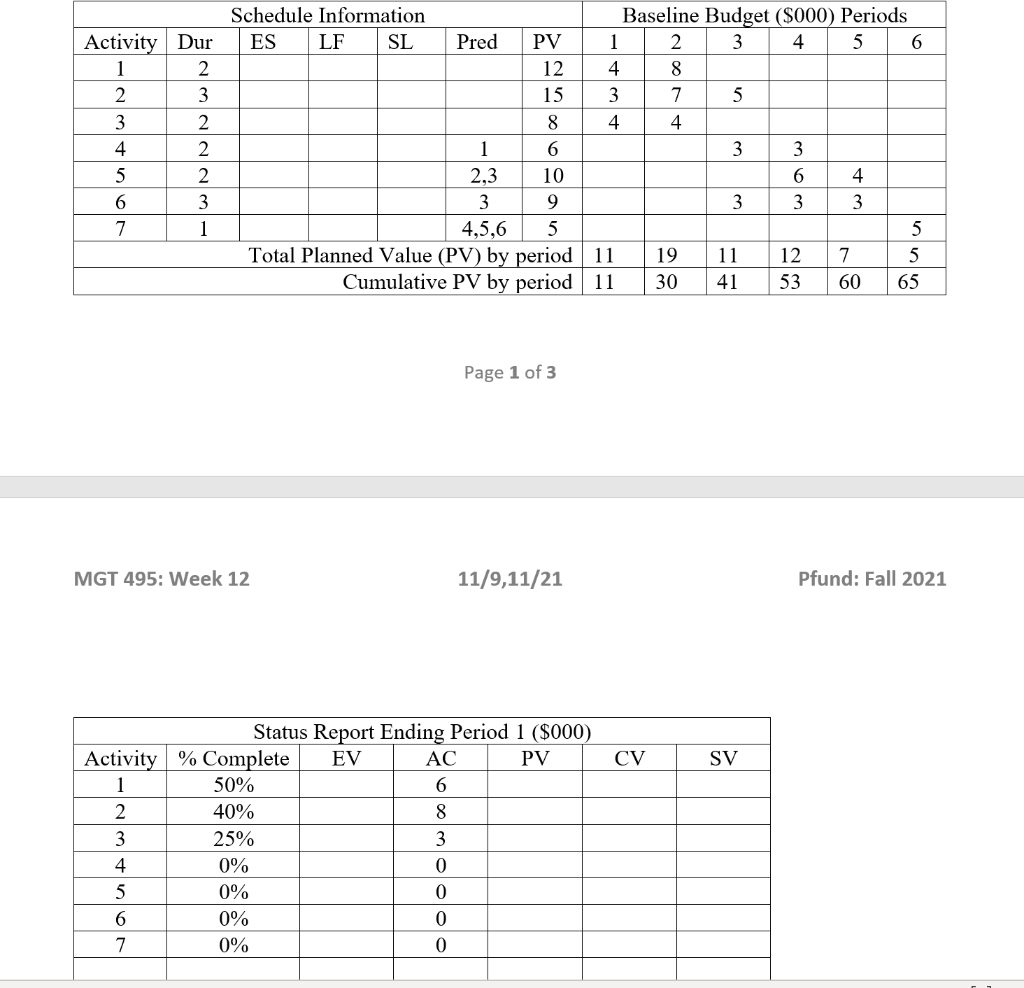
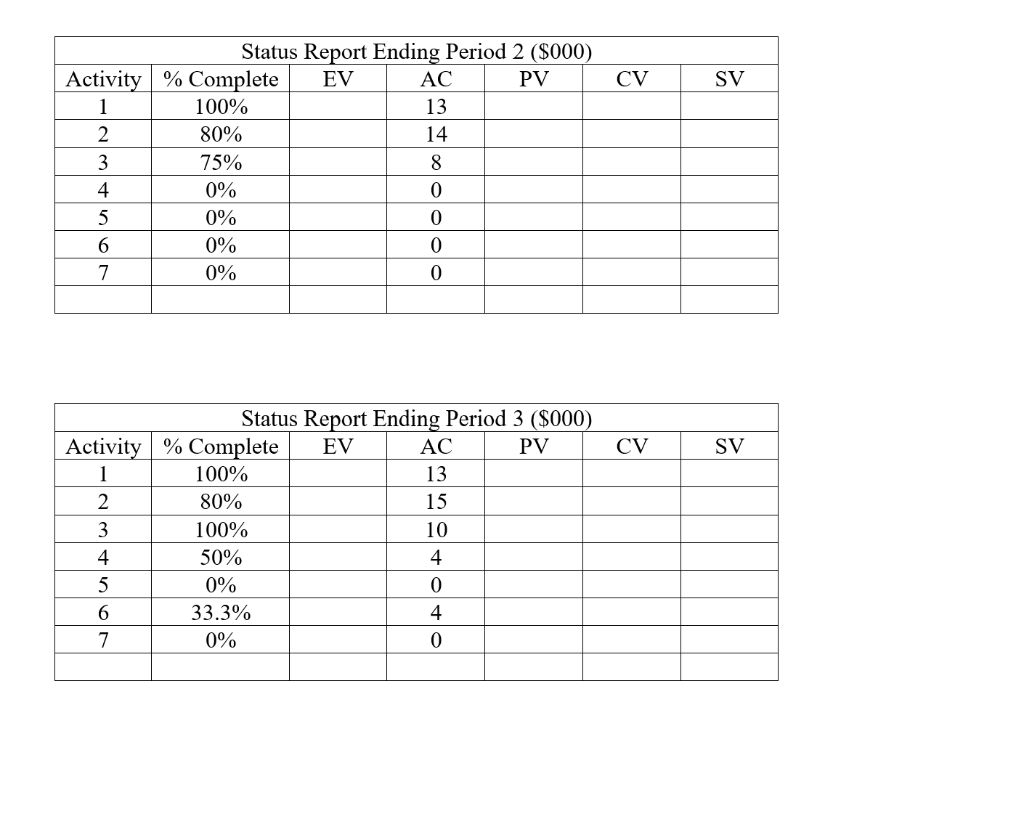
Question: Given the following schedule information and baseline budget, develop status reports for periods 1 - 4 and complete the project summary graph (or a similar

Given the following schedule information andGiven the following schedule information andGiven the following schedule information andGiven the following schedule information and

Given the following schedule information and baseline budget, develop status reports for periods 1 - 4 and complete the project summary graph (or a similar one). Report SV, CV, CPI, and PCIB. Write four status reports. One each for periods 1, 2, 3, and 4. (10 points each) 1. Include an introduction in each status report which explains how far along the project is and what data is available. Use your own words, not those of the text or your classmates. 2. Include the tabular form in each status report with the columns EV, PV, CV, and SV completed. 3. Include a summary graph in each status report. Your choice whether you choose to plot dollars or indices versus time period. 4. Include an assessment of the status of the project in each status report. Again, use your own words. 5. Include in each status report your forecast of the project at completion. Use extrapolated data to substantiate your claims. (10 pts.) Schedule Information Baseline Budget ($000) Periods Activity Dur ES LF SL Pred PV 1 2 3 4 5 6 1 2 12 4 8 2 3 15 3 7 5 3 2 8 4 4 4 2 1 6 3 3 5 2 2.3 10 6 4 6 3 3 9 3 3 3 7 1 4,5,6 5 5 Total Planned Value (PV) by period 11 19 11 12 7 5 Cumulative PV by period 11 30 41 53 60 65 Page 1 of 3 MGT 495: Week 12 11/9,11/21 Pfund: Fall 2021 CV SV Status Report Ending Period 1 ($000) Activity % Complete EV AC PV 1 50% 6 2 40% 8 3 25% 3 4 0% 0 5 0% 0 6 0% 0 0% 0 CV SV Status Report Ending Period 2 ($000) Activity % Complete EV AC PV 1 100% 13 2 80% 14 3 75% 8 4 0% 0 5 0 6 0% 0 7 0 0% 0% CV SV Status Report Ending Period 3 ($000) Activity % Complete EV AC PV 1 100% 13 2 80% 15 3 100% 10 4 50% 4 5 0% 0 6 33.3% 4 7 0% 0 CV SV Status Report Ending Period 4 ($000) Activity % Complete EV AC PV 1 100% 13 2 100% 18 3 100% 10 4 100% 8 5 30% 3 6 66.7% 8 7 0% 0 Chart Title 100 90 80 70 60 50 40 30 20 10 0 Period 1 Period 2 Period 3 Period 4 Period 5 Period 6 Period 7 Period 8 EVAC-PV

Step by Step Solution

There are 3 Steps involved in it

1 Expert Approved Answer
Step: 1 Unlock blur-text-image
Question Has Been Solved by an Expert!

Get step-by-step solutions from verified subject matter experts

Step: 2 Unlock
Step: 3 Unlock

Students Have Also Explored These Related General Management Questions!