

Question: Given the following table of processes and services time P5 Process Service Time P1 320 P2 190 P3 270 P4 90 210 Draw a Gantt
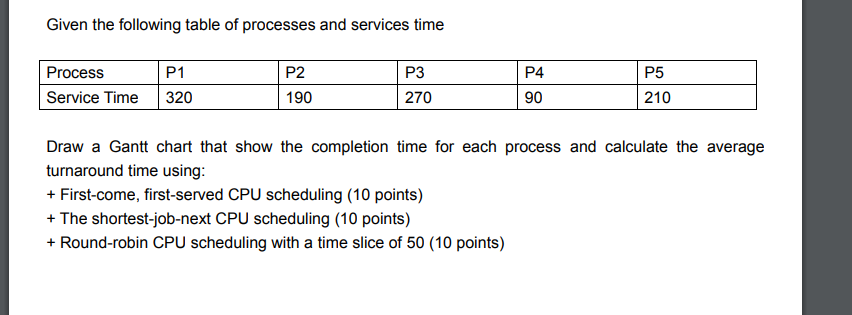
Given the following table of processes and services time P5 Process Service Time P1 320 P2 190 P3 270 P4 90 210 Draw a Gantt chart that show the completion time for each process and calculate the average turnaround time using: + First-come, first-served CPU scheduling (10 points) + The shortest-job-next CPU scheduling (10 points) + Round-robin CPU scheduling with a time slice of 50 (10 points)
Step by Step Solution
There are 3 Steps involved in it
1 Expert Approved Answer
Step: 1 Unlock

Question Has Been Solved by an Expert!
Get step-by-step solutions from verified subject matter experts
Step: 2 Unlock
Step: 3 Unlock