

Question: Given the following Treasury bond yield information, construct a graph of the yield curve. Maturity Yield 1 year 5.32 % 2 years 5.37 3 years
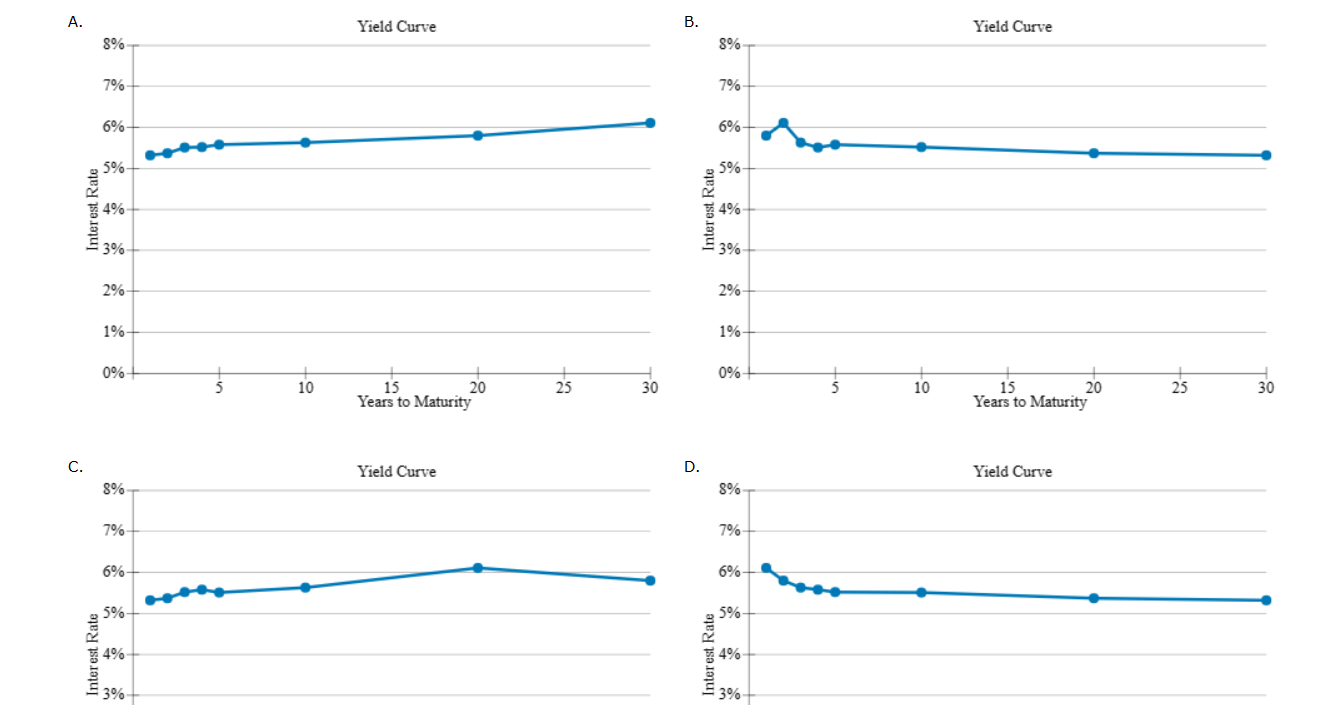
Given the following Treasury bond yield information, construct a graph of the yield curve.
| Maturity | Yield | |
| 1 year | 5.32 | % |
| 2 years | 5.37 | |
| 3 years | 5.52 | |
| 4 years | 5.58 | |
| 5 years | 5.51 | |
| 10 years | 5.63 | |
| 20 years | 6.11 | |
| 30 years | 5.80 | |
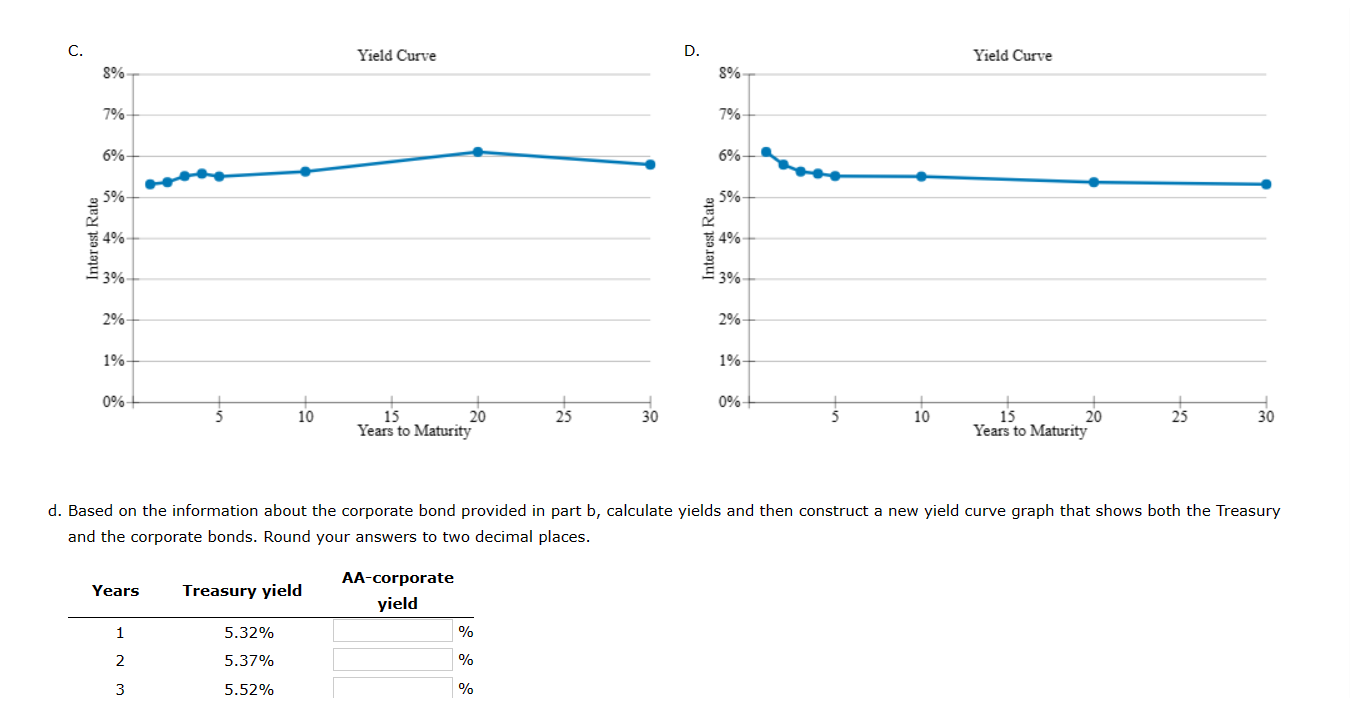
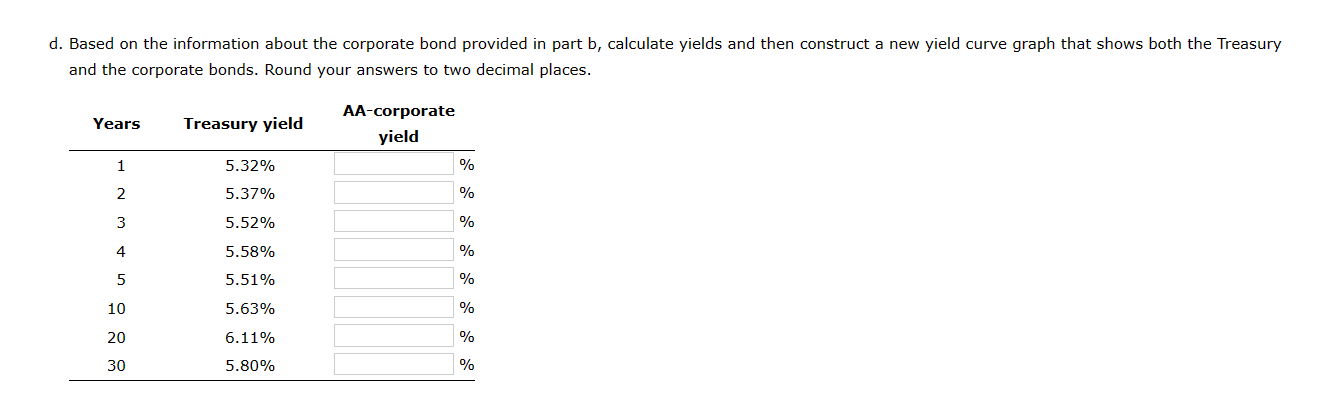
d. Based on the information about the corporate bond provided in part b, calculate yields and then construct a new yield curve graph that shows both the Treasury and the corporate bonds. Round your answers to two decimal places. d. Based on the information about the corporate bond provided in part b, calculate yields and then construct a new yield curve graph that shows both the Treasury and the corporate bonds. Round your answers to two decimal places. A. C. B. D
Step by Step Solution
There are 3 Steps involved in it
1 Expert Approved Answer
Step: 1 Unlock

Question Has Been Solved by an Expert!
Get step-by-step solutions from verified subject matter experts
Step: 2 Unlock
Step: 3 Unlock