

Question: Given the information as below, please use Excel to draw the graph showing the relationship between TCP Congestion Window size and Time (RTT). 1. Initialized
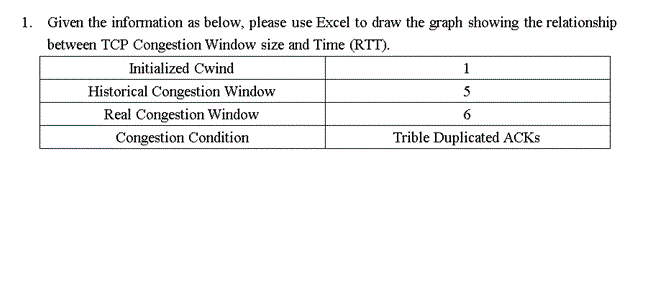
Given the information as below, please use Excel to draw the graph showing the relationship between TCP Congestion Window size and Time (RTT). 1. Initialized Cwind Historical Congestion Window Real Congestion Window Congestion Condition Trible Duplicated ACKs
Step by Step Solution
There are 3 Steps involved in it
1 Expert Approved Answer
Step: 1 Unlock

Question Has Been Solved by an Expert!
Get step-by-step solutions from verified subject matter experts
Step: 2 Unlock
Step: 3 Unlock