

Question: Programming Assignment 2 Implementing a Reliable Data Transport Protocol 1 Objective Since youve learned about the socket interface and how it is used by an
Programming Assignment 2 Implementing a Reliable Data Transport Protocol
1 Objective
Since youve learned about the socket interface and how it is used by an application; by now, youre pretty much an expert in how to use the socket interface over a reliable transport layer, so now seems like a good time to implement your own socket layer and reliable transport layer! Youll get to learn how the socket interface is implemented by the kernel and how a reliable transport protocol like TCP runs on top of an unreliable delivery mechanism (which is the real world, since in real-world networks nothing is reliable). This lab should be fun since your implementation will differ very little from what would be required in a real-world situation.
The network communication in the upper two stages was provided through a reliable transfer protocol (TCP/IP). In this stage, you are required to implement a reliable transfer service on top of the UDP/IP protocol. In other words, you need to implement a service that guarantees the arrival of datagrams in the correct order on top of the UDP/IP protocol, along with congestion control.
2 Reliability Specifications
2.1 Introduction and Background
Please refer to the lectures slides for reliable data transfer techniques: Go-back-N, Stop and Wait, and Selective repeat.
2.2 Specifications
Suppose you have a file and you want to send this file from one side to the other(server to client), you will need to split the file into chunks of data of fixed length and add the data of one chunk to a UDP datagram packet in the data field of the packet. Two methods of RDT should be implemented:
2.2.1 Stop-and-Wait
The server sends a single datagram, and blocks until an acknowledgment from the client is received (or until a timeout expires).
2.2.2 Selective repeat
At any given time, the server is allowed to have up to N datagrams that have not yet been acknowledged by the client. The server has to be able to buffer up to N datagrams since it should be able to retransmit them until they get acknowledged by the client. Moreover, the server has to associate a timer with each datagram transmitted, so that it can retransmit a datagram if it is not acknowledged in time.
2.3 Packet types and fields
There are two kinds of packets, Data packets, and Ack-only packets. You can tell the type of a packet by its length. Ack packets are 8 bytes, while Data packets vary from 12 to 512 bytes (This is just an example but youre free to choose the header/data size for the packets).
/* Data-only packets */
struct packet { /* Header */
};
uint16_t cksum; /* Optional bonus part */ uint16_t len; uint32_t seqno; /* Data */
char data[500]; /* Not always 500 bytes, can be less */
/* Ack-only packets are only 8 bytes */
struct ack_packet { uint16_t cksum; /* Optional bonus part */ uint16_t len; uint32_t ackno;
};
3.1
Congestion Control
Introduction and Background
congestion is informal: "too many sources sending too much data too fast for the network to handle", there are two main indicators for congestion: lost packets (buffer overflow at routers) long delays (queuing in router buffers). No handling network congestion may lead to unneeded retransmissions(link carries multiple copies of a packet since when packet dropped, any upstream transmission capacity used for that packet was wasted)!
3.2 Additive increase Multiplicative decrease
In this approach: the sender increases transmission rate (window size), probing for usable bandwidth until a loss occurs. You are asked to implement a dynamic window size that is changed based on the congestion of the network, where a packet loss happens after N0 packets sent, then you will send another N1 packet then another loss happens, and so on.
LastByteSent - LastByteAcked
The format of the file would be:
4 Packet Loss Simulation
CS5710: Computer Networks Assigned: Monday, March 9th, 20
Due: Monday, April 13th, 20
Since we dont have machines with OS that we can modify, your implementation will run in a simulated environment, this means that we will simulate the packet loss probability (PLP) since packet loss is infrequent in a localhost or LAN environment.
4.1 Specifications
PLP ranges from 0 to 1. For PLP=0 your implementation should behave with no packet loss. For non-zero values of PLP, you should simulate packet loss (by dropping datagrams given as parameters to the send() method) with the corresponding probability - i.e. a datagram given as a parameter to the send() method is transmitted only 100*(1 - PLP)% of the time (A value of 0.1 would mean that one in ten packets (on average) are lost.).
5 Workflow between server and client
5.1 Flow of data
The main steps are:
-
The client sends a datagram to the server giving the filename for the transfer. This send needs to be backed up by a timeout in case the datagram is lost.
-
The server forks off a child process to handle the client.
-
The server (child) creates a UDP socket to handle file transfer to the client.
-
The server sends its first datagram, the server uses some random number generator random() function to decide with probability p if the datagram would be passed to the method send() or just ignore sending it
-
Whenever a datagram arrives, an ACK is sent out by the client to the server.
-
If you choose to discard the package and not to send it from the server the timer will end at the server waiting for the ACK that it will never come from the client (since the packet wasnt sent to it) and the packet will be resent again from the server.
-
Update the window, and make sure to order the datagrams at the client-side.
-
repeat those steps till the whole file is sent and no other datagrams remain.
-
close the connection.
5.2 Handling time-out
Youre supposed to use a timer(one timer per datagram) at the server side to handle time-out events.
5.3 Arguments for the client
The client is to be provided with an input file client. in from which it reads the following information, in the order shown, one item per line :
The IP address of the server. A well-known port number of the server. Port number of the client. Filename to be transferred (should be a large file). Initial receiving sliding-window size (in datagram units).
5.4 Arguments for the server
You should provide the server with an input file server. from which it reads the following information, in the order shown, one item per line :
Well-known port number for the server. Maximum sending sliding-window size (in datagram units). Random generator seed value. Probability p of datagram loss
(real number in the range [ 0.0, 1.0 ]).
6 Network system analysis
You should provide a comparison between stop-and-wait and selective repeat strategies in terms of throughput, based on a series of transfers of large files (e.g.: 4 MBytes, or higher). Your test runs should be performed with at least the following PLP values: 1%, 5%, 10%, and 30%. For each PLP value, you should report the average of at least 5 (consecutive) runs. For the congestion control, you should print a graph showing like the one in the lectures slides.
7 Bonus
-
Any extra analysis in the report will be highly appreciated.
-
Implementing the Go-Back-N technique and comparing its results to the other techniques.
-
Error detection and checksumming - You will need some kind of checksumming to detect errors. The Internet checksum is a good candidate here. Remember that no checksumming can detect all errors but your checksum should have sufficient number of bits (e.g. 16 bit in Internet checksum) to make undetected errors very rare. We can not guarantee completely error-free delivery because of checksummings limitation. But you should be convinced that this should happen very rarely with a good checksumming technique.
8 Notes
-
You must provide a suitable way for observing the loss of packets, time-outs and resending packets.
-
Dont limit yourself with the problem statement, youve the reference, the lecture slides and the mighty google, those protocols are working in the real-world not theoritical proposals, if you think youve a better/more right implementation for what is required please do it.
-
START SIMPLE. Set the probabilities of loss and corruption to zero and test out your routines. Better yet, design and implement your procedures for the case of no loss and no corruption, and get them working first. Then handle the case of one of these probabilities being non-zero, and then finally both being non-zero.
-
You must understand thoroughly the main difference between UDP and TCP, so you can provide the functionalities of TCP-like protocol using UDP, from the main differences is the ordering of packets, reliability and Congestion control.
-
Expert Answer
An expert answer will be posted here
Up next for you in Computer Science
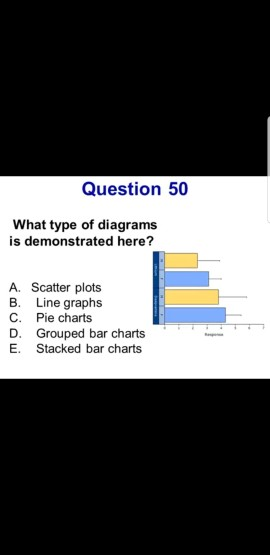
Question 50 What type of diagrams is demonstrated here? A. Scatter plots B. Line graphs C. Pie chart
See answer
Consider a subnet with prefix 128.119.40.128/26. Give an example of one IP address (of form xxx.xxx.xxx.xxx) that can be assigned to this network. Suppose an ISP owns a block of addresses in the form 1
See answer
See more questions for subjects you study
Questions viewed by other students
Q:
Answer the following questions: Explain what might happen if two stations are accidentally assignedthe same hardware address? If sharing reduces cost, why are shared networks used only forlocal communication? Why wireless LAN can not use the same CSMA/CD mechanism that ethernet uses?
Q:
This assignment asks you to develop a basic File Transfer Protocol (FTP) application that transmits files between a client and a server using Python. Your programs should implement four FTP commands: (1) change directory(cd), (2) list directory content (ls), (3) copy a file from client to a server (put), and (4) copy a file from a server to a client (get). The project will be.
Question 50 What type of diagrams is demonstrated here? A. Scatter plots B. Line graphs C. Pie charts D. Grouped bar charts E. Stacked bar charts Question 50 What type of diagrams is demonstrated here? A. Scatter plots B. Line graphs C. Pie charts D. Grouped bar charts E. Stacked bar chartsStep by Step Solution
There are 3 Steps involved in it

Get step-by-step solutions from verified subject matter experts