

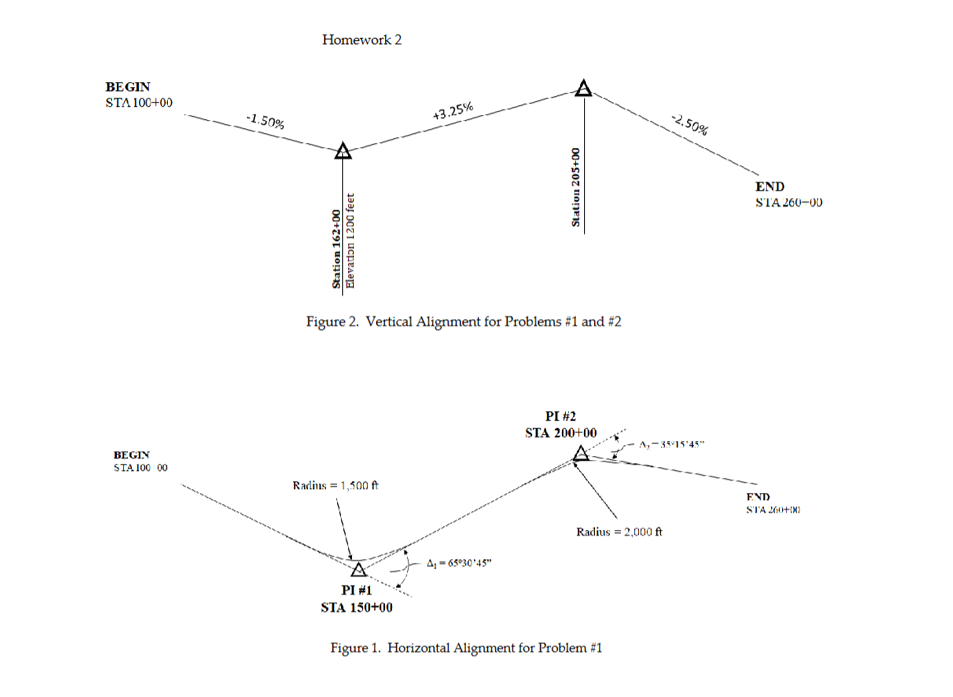
Question: Given: The information shown in Figures 1 and 2 , along with the data provided below, should be used to establish the horizontal alignment and
Given:
The information shown in Figures and along with the data provided below, should
be used to establish the horizontal alignment and vertical profile:
Design speed: for entire alignment
Setting: Rural
Normal crown crossslope: high point at roadway centerline
Maximum rate of superelevation:
Crosssection: Twotravel lanes one in each direction @ feet wide
Find:
a Length of superelevation transition tangent runout plus superelevation runoff
for horizontal curve #
b Draw the superelevation transition profile show transition at the beginning and
end of the curve PC and PT stations should be shown on profile plot for
horizontal curve # The axis of rotation for the tangenttocurve transition is the
centerline of the roadway.
c Draw crosssections including stations at the beginning of the superelevation
transition, removal of adverse crown, uniform crossslope, and location where
full superelevation is first attained for horizontal curve # Show crosssections
for both ends of transition PC and PT ends of curve including the elevation
data. The minimum length of vertical curve, based on the design speed, should
be used for the elevation computations.
Step by Step Solution
There are 3 Steps involved in it
1 Expert Approved Answer
Step: 1 Unlock

Question Has Been Solved by an Expert!
Get step-by-step solutions from verified subject matter experts
Step: 2 Unlock
Step: 3 Unlock