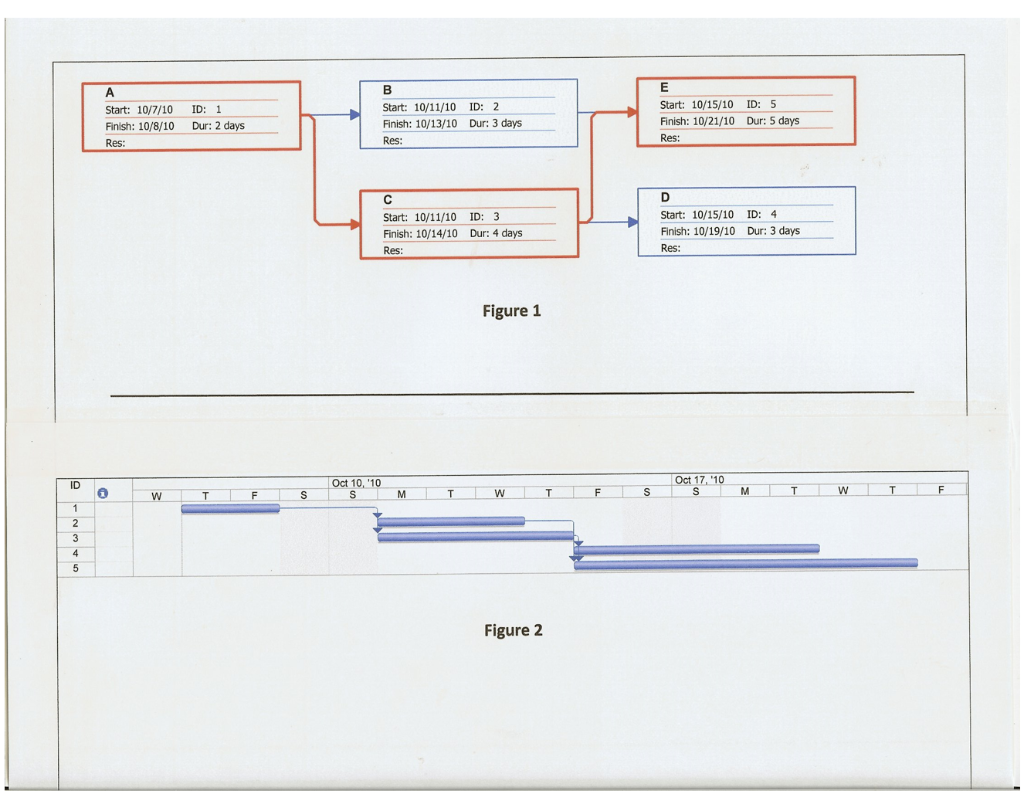
Question: Given the Microsoft Project output shown in attached Figures 1 and 2: a. Figure 1 is commonly called what type of diagram? b. Figure 2

Given the Microsoft Project output shown in

Given the Microsoft Project output shown in

Given the Microsoft Project output shown in attached Figures 1 and 2: a. Figure 1 is commonly called what type of diagram? b. Figure 2 is commonly called what type of diagram? c. Interpret these two diagrams to determine the following for each activity and complete the table below: Immediate predecessor(s) Activity time Early start date Early finish date Late start date Total slack in the activity (in days) Whether it is on the Critical Path (y) Activity Immediate Predecessor (S) Task Critical Path? Early Finish Late Finish Date Total Slack Time Date (y) A B D E A Start: 10/7/10 Finish: 10/8/10 Res ID: 1 Dur: 2 days B Start: 10/11/10 ID: 2 Finish: 10/13/10 Dur: 3 days Res: E Start: 10/15/10 ID: 5 Finish: 10/21/10 Dur: 5 days Res: Start: 10/11/10 ID: 3 Finish: 10/14/10 Dur: 4 days Res D Start: 10/15/10 ID: 4 Finish: 10/19/10 Dur: 3 days Res: Figure 1 ID Oct 10, '10 s Oct 17, '10 S F M M T T w w T T s F 1 2 3 4 5 Figure 2

Step by Step Solution

There are 3 Steps involved in it

1 Expert Approved Answer
Step: 1 Unlock blur-text-image
Question Has Been Solved by an Expert!

Get step-by-step solutions from verified subject matter experts

Step: 2 Unlock
Step: 3 Unlock

Students Have Also Explored These Related General Management Questions!