

Question: Given the optimistic estimate (t), most likely estimate (tm) and pessimistic estimate (tp) as shown in Table 3 , based on the positively skewed beta
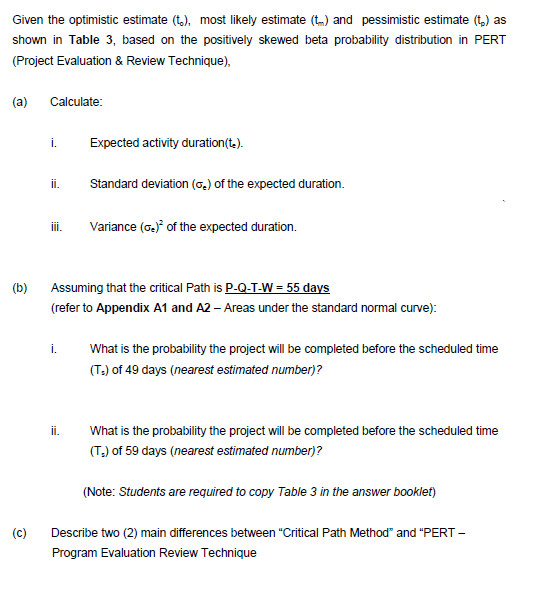
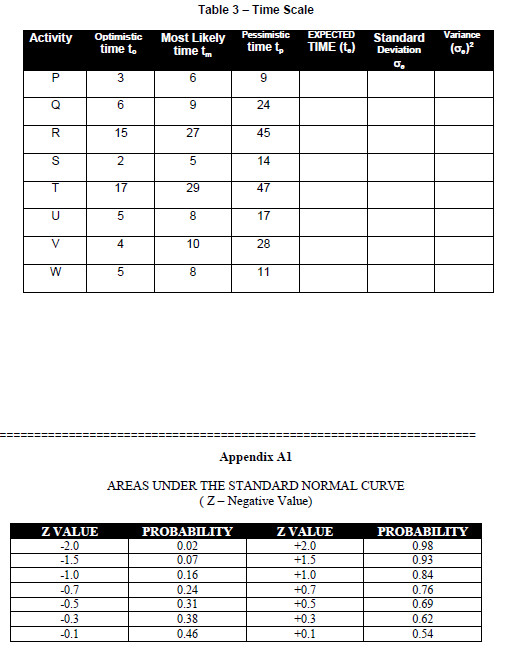
Given the optimistic estimate (t), most likely estimate (tm) and pessimistic estimate (tp) as shown in Table 3 , based on the positively skewed beta probability distribution in PERT (Project Evaluation \& Review Technique), (a) Calculate: i. Expected activity duration(to). ii. Standard deviation (e) of the expected duration. iii. Variance (e)2 of the expected duration. (b) Assuming that the critical Path is P-Q-T-W =55 days (refer to Appendix A1 and A2 - Areas under the standard normal curve): i. What is the probability the project will be completed before the scheduled time (Ts) of 49 days (nearest estimated number)? ii. What is the probability the project will be completed before the scheduled time (Ts) of 59 days (nearest estimated number)? (Note: Students are required to copy Table 3 in the answer booklet) (c) Describe two (2) main differences between "Critical Path Method" and "PERT Program Evaluation Review Technique Table 3-Time Scale Appendix Al AREAS UNDER THE STANDARD NORMAL CURVE ( Z-Negative Value)
Step by Step Solution
There are 3 Steps involved in it

Get step-by-step solutions from verified subject matter experts