

Question: Given the QPSK constellation diagram shown below, using MATLAB plot the QPSK signal given a bit rate of 10Mbps and a carrier frequency of 10MHz
Given the QPSK constellation diagram shown below, using MATLAB plot the QPSK signal given a bit rate of 10Mbps and a carrier frequency of 10MHz for the bit sequence [1 0 1 1 0 1 0 0]. The amplitude and phase must be correct.
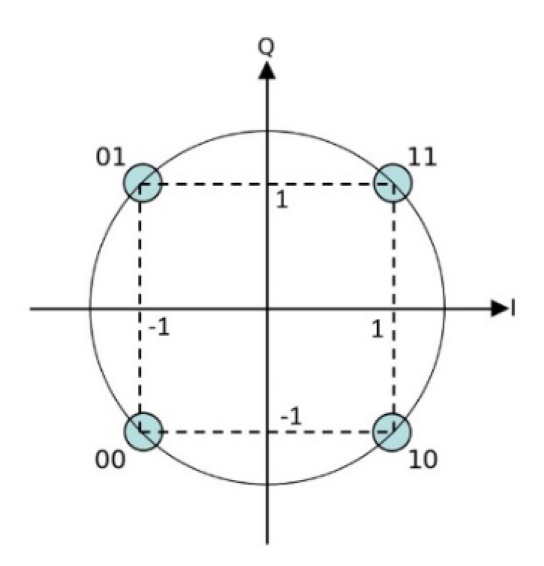
01 11 1 00 10
Step by Step Solution
There are 3 Steps involved in it
1 Expert Approved Answer
Step: 1 Unlock

Question Has Been Solved by an Expert!
Get step-by-step solutions from verified subject matter experts
Step: 2 Unlock
Step: 3 Unlock