

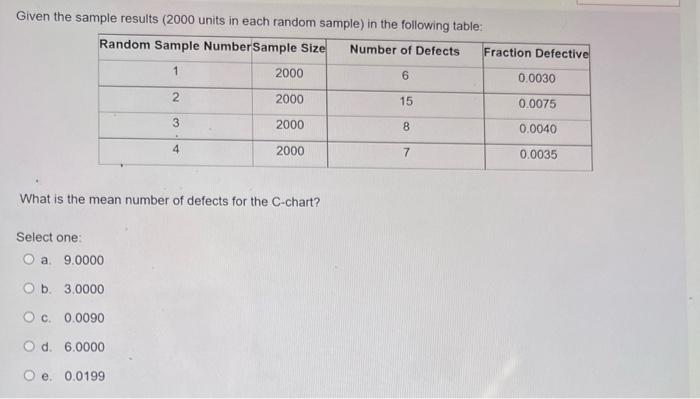
Question: Given the sample results (2000 units in each random sample) in the following table: What is the mean number of defects for the C-chart? Select
Step by Step Solution
There are 3 Steps involved in it
1 Expert Approved Answer
Step: 1 Unlock

Question Has Been Solved by an Expert!
Get step-by-step solutions from verified subject matter experts
Step: 2 Unlock
Step: 3 Unlock