

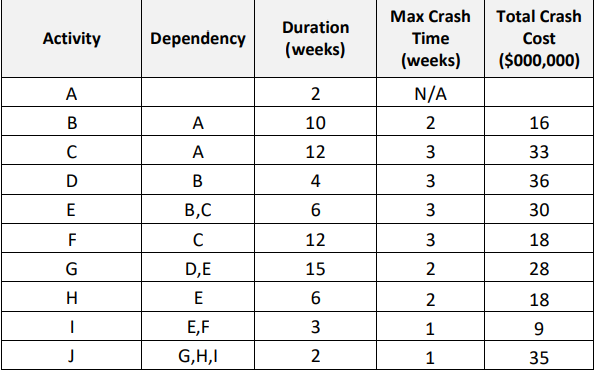
Question: Given the table below: Activity Dependency Duration ( weeks ) Max Crash Time ( weeks ) Total Crash Cost ( $ 0 0 0 ,
Given the table below: Activity Dependency Duration weeks Max Crash Time weeks Total Crash Cost $ A NA B A C A D B E BC F C G DE H E I EF J GHI
Draw the network diagram
What is the critical path and length of this project?
There is a time constraint on this project it may be necessary to reduce the timeline. If possible. The indirect cost savings is $ per week. Provide the steps and process to reduce the timeline of this project
What is the maximum time that this projects timeline can be reduced, what is the total cost, and what is the new duration?
How many days would YOU crash this project? Why? How much extra would it cost Note that although it is timeconstrained, the budget is not unlimited.
Provide the final network diagram using the maximum crash time
please draw the diagrams and charts if possible.
Step by Step Solution
There are 3 Steps involved in it
1 Expert Approved Answer
Step: 1 Unlock

Question Has Been Solved by an Expert!
Get step-by-step solutions from verified subject matter experts
Step: 2 Unlock
Step: 3 Unlock