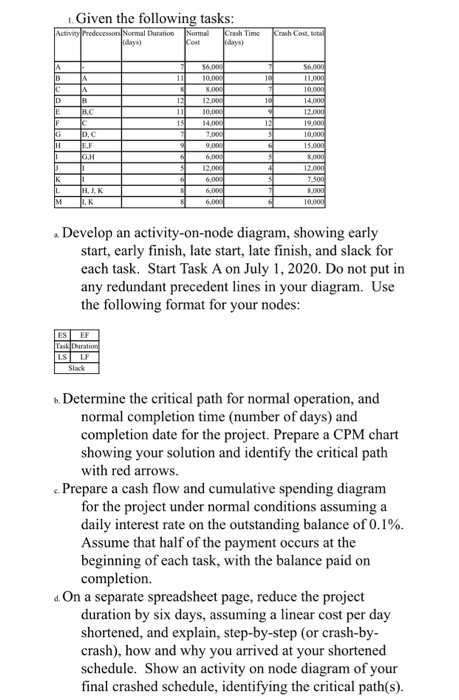
Question: 1. Given the following tasks: Activity Predecessors Normal Duration Normal Crash Time Cost (days) Crash Cost total A B 11 $6,000 10.000 8.000 12.000 1

1. Given the following tasks: Activity
1. Given the following tasks: Activity Predecessors Normal Duration Normal Crash Time Cost (days) Crash Cost total A B 11 $6,000 10.000 8.000 12.000 1 11 10 C D JE F G | 1 12 I! 15 10 12 B BC C D. EF G.H 1 56,000 11.000 10.000 14.000 12.00 19.000 10.000 1S. ROOD 12,000 7.300 R.000 10,000 14.000 7.000 9,000 6.000 12.000 6,000 6,000 6,000 9 5 G JK IL M HJ.K 1K . Develop an activity-on-node diagram, showing early start, early finish, late start, late finish, and slack for each task. Start Task A on July 1, 2020. Do not put in any redundant precedent lines in your diagram. Use the following format for your nodes: ES EF Task Duration LS LF Slack b. Determine the critical path for normal operation, and normal completion time (number of days) and completion date for the project. Prepare a CPM chart showing your solution and identify the critical path with red arrows. c. Prepare a cash flow and cumulative spending diagram for the project under normal conditions assuming a daily interest rate on the outstanding balance of 0.1%. Assume that half of the payment occurs at the beginning of each task, with the balance paid on completion. d. On a separate spreadsheet page, reduce the project duration by six days, assuming a linear cost per day shortened, and explain, step-by-step (or crash-by- crash), how and why you arrived at your shortened schedule. Show an activity on node diagram of your final crashed schedule, identifying the critical path(s)

Step by Step Solution

There are 3 Steps involved in it

1 Expert Approved Answer
Step: 1 Unlock blur-text-image
Question Has Been Solved by an Expert!

Get step-by-step solutions from verified subject matter experts

Step: 2 Unlock
Step: 3 Unlock

Students Have Also Explored These Related General Management Questions!