

Question: Given the table below - Identify which curve refers to Given the table below: Total Product 2 4 6 7 8 9 10 Total Fixed

Given the table below - Identify which curve refers to
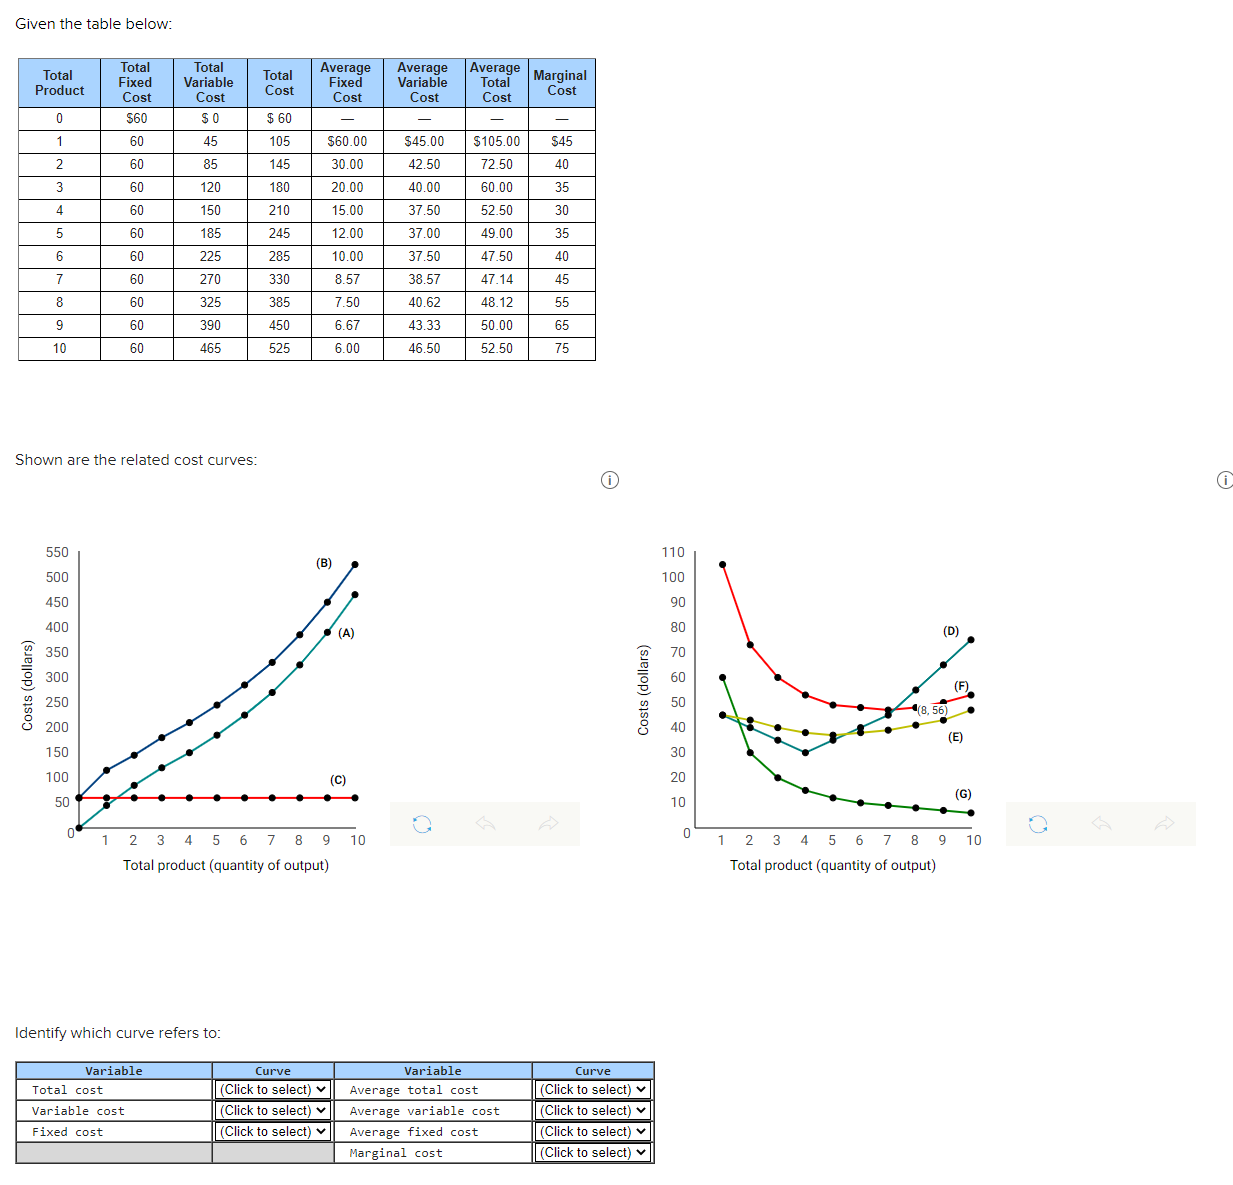
Given the table below: Total Product 2 4 6 7 8 9 10 Total Fixed Cost S60 60 60 60 60 60 60 60 60 60 60 Total Variable Cost so 45 85 185 270 390 Total Cost $60 105 145 210 245 285 330 450 Average Fixed Cost s60_oo 30 00 20 00 1500 1200 10 00 8.57 7.50 6.67 6.00 (A) 10 Average Variable Cost S45_oo 4250 40 00 37 50 37 00 37 50 38 57 40 62 43 33 46 50 Variable Average Total Cost S10500 72.50 60.00 52.50 49.00 47.50 47.14 48.12 smoo 52.50 Shown are the related cost curves: 550 500 450 400 2 350 300 250 200 150 100 50 2345678 Marginal Cost S45 40 35 30 35 40 45 55 65 76 110 100 90 80 70 60 50 40 30 20 10 Curve (Click to select) v (Click to select) v (Click to select) v (Click to select) v (E) 123456789 Total product (quantity of output) 10 Total product (quantity of output) Identify which curve refers to: Total cost Variable cost Fixed cost Curve (Click to select) v (Click to select) v (Click to select) v Average total cost Average variable cost Average fixed cost Marginal cost
Step by Step Solution
There are 3 Steps involved in it

Get step-by-step solutions from verified subject matter experts