

Question: Given the table1 below #> # A tibble: 6 x 4 #> country year cases population #> #> 1 Afghanistan 1999 745 19987071 #>
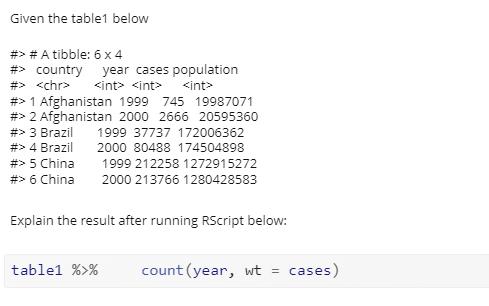
Given the table1 below #> # A tibble: 6 x 4 #> country year cases population #> #> 1 Afghanistan 1999 745 19987071 #> 2 Afghanistan 2000 2666 20595360 #> 3 Brazil 1999 37737 172006362 #> 4 Brazil 2000 80488 174504898 # > 5 China #> 6 China 1999 212258 1272915272 2000 213766 1280428583 Explain the result after running RScript below: table1 %>% count (year, wt = cases)
Step by Step Solution
There are 3 Steps involved in it
1 Expert Approved Answer
Step: 1 Unlock

The image shows a tibble a type of data frame in R named table1 with the following columns country y... View full answer
Question Has Been Solved by an Expert!
Get step-by-step solutions from verified subject matter experts
Step: 2 Unlock
Step: 3 Unlock