

Question: Given the two databases shown in Figure 1 , develop fragility curves for a reinforced concrete bridge column across four damage states using two different
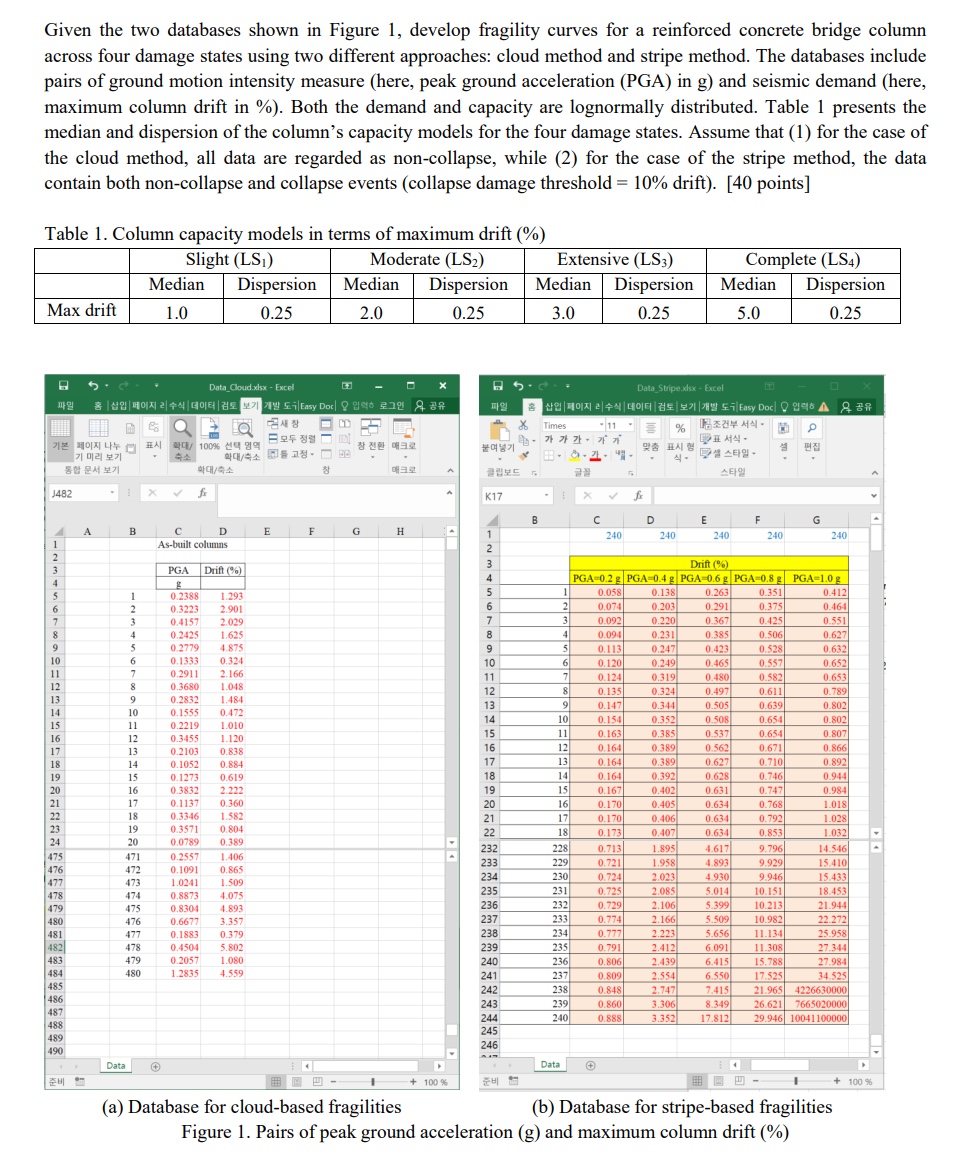
Given the two databases shown in Figure develop fragility curves for a reinforced concrete bridge column across four damage states using two different approaches: cloud method and stripe method.
The databases include pairs of ground motion intensity measure here peak ground acceleration PGA in g and seismic demand here maximum column drift in
Both the demand and capacity are lognormally distributed. Table presents the median and dispersion of the columns capacity models for the four damage states.
Assume that for the case of the cloud method, all data are regarded as noncollapse, while for the case of the stripe method, the data contain both noncollapse and collapse events collapse damage threshold drift points
I would appreciate it if you could provide R language coding for solving the task.
Step by Step Solution
There are 3 Steps involved in it
1 Expert Approved Answer
Step: 1 Unlock

Question Has Been Solved by an Expert!
Get step-by-step solutions from verified subject matter experts
Step: 2 Unlock
Step: 3 Unlock