

Question: Given this data. Can someone help make both into graphs X o Inventory/Quantity Discount (EOQ) Model Results Southwestern Solution Parameter Value Demand rate(D) 200000 Setup/ordering
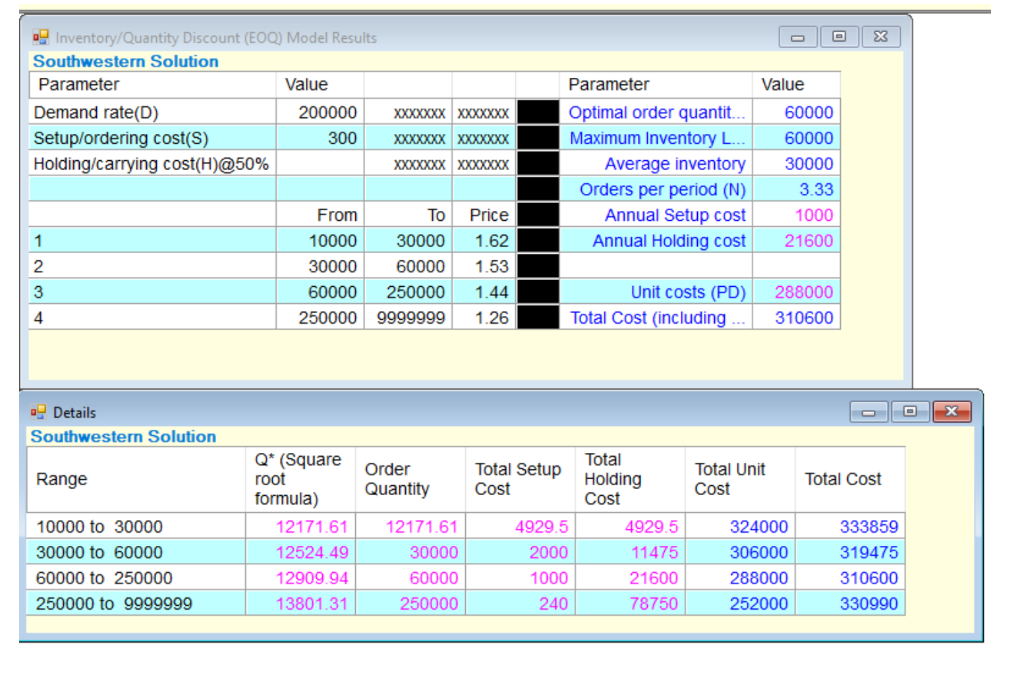
Given this data. Can someone help make both into graphs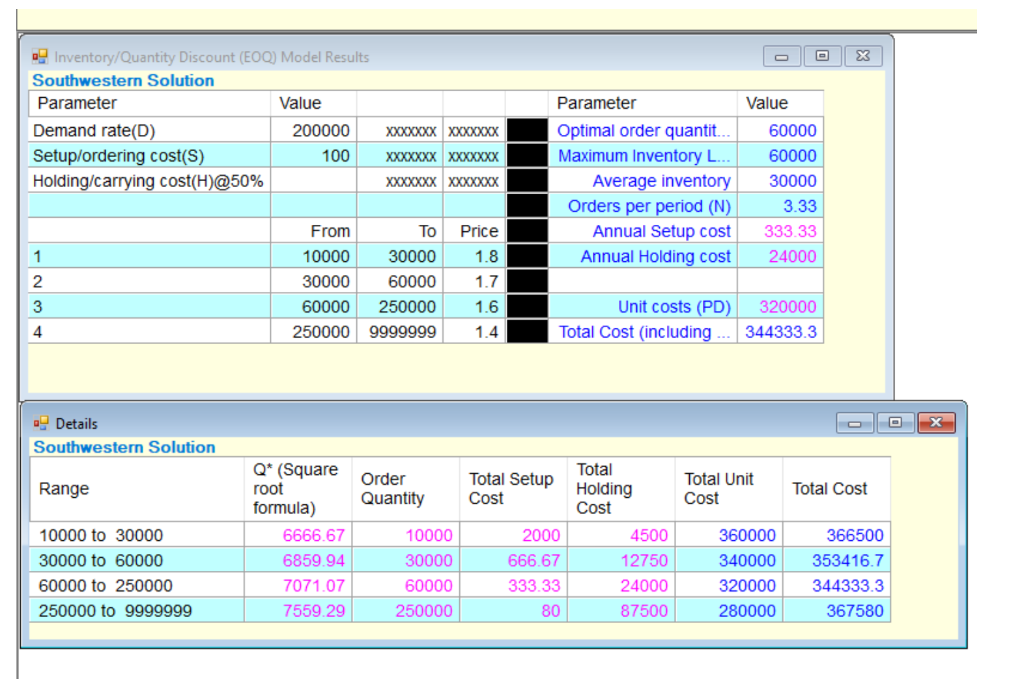
Step by Step Solution
There are 3 Steps involved in it
1 Expert Approved Answer
Step: 1 Unlock

Question Has Been Solved by an Expert!
Get step-by-step solutions from verified subject matter experts
Step: 2 Unlock
Step: 3 Unlock