

Question: Given this frequency distribution, what demand values would be associated with the following random numbers? (Do not round intermediate calculations.) Demand 0 1 Frequency 24
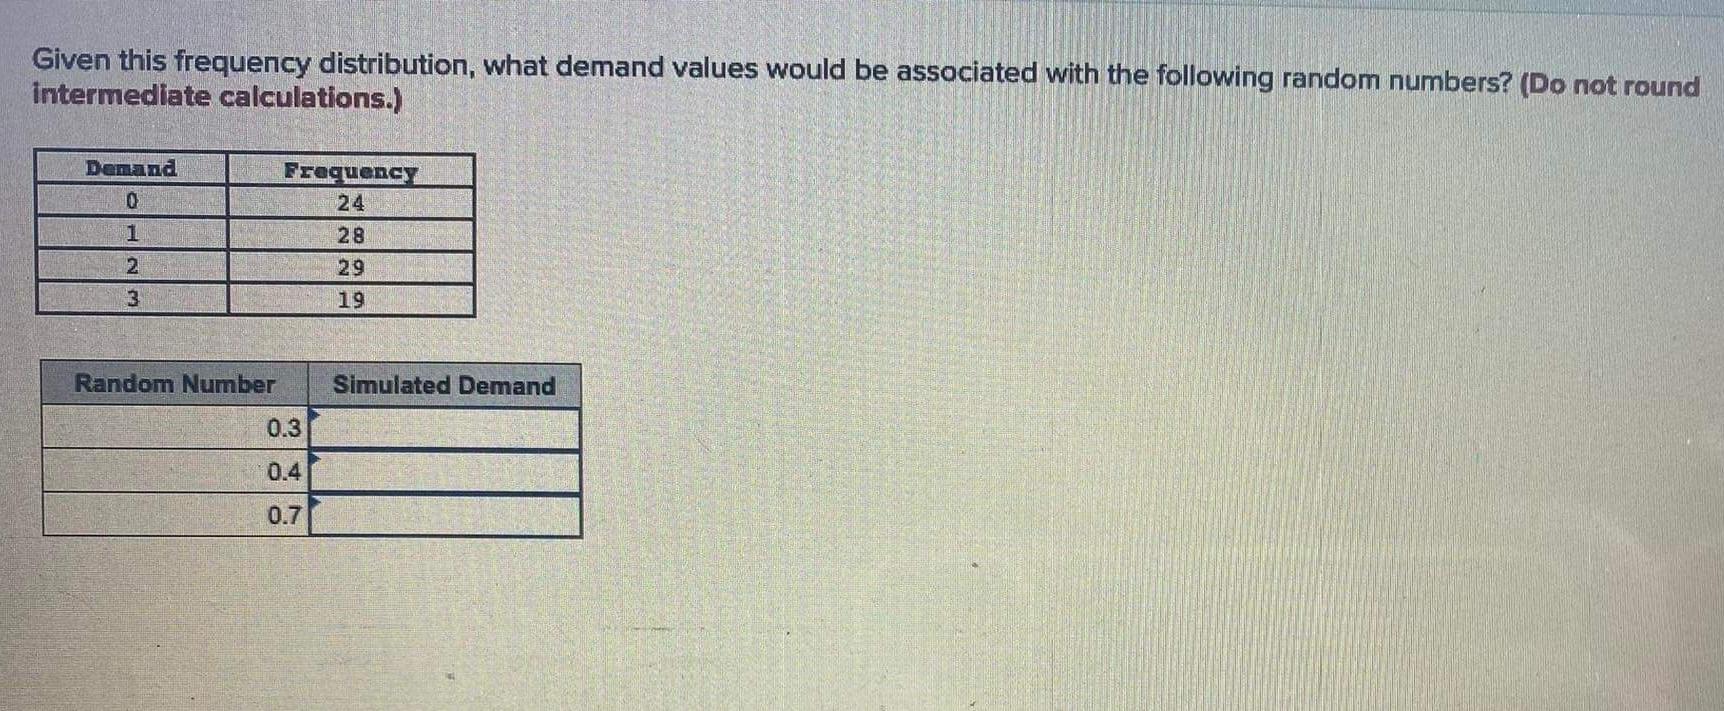
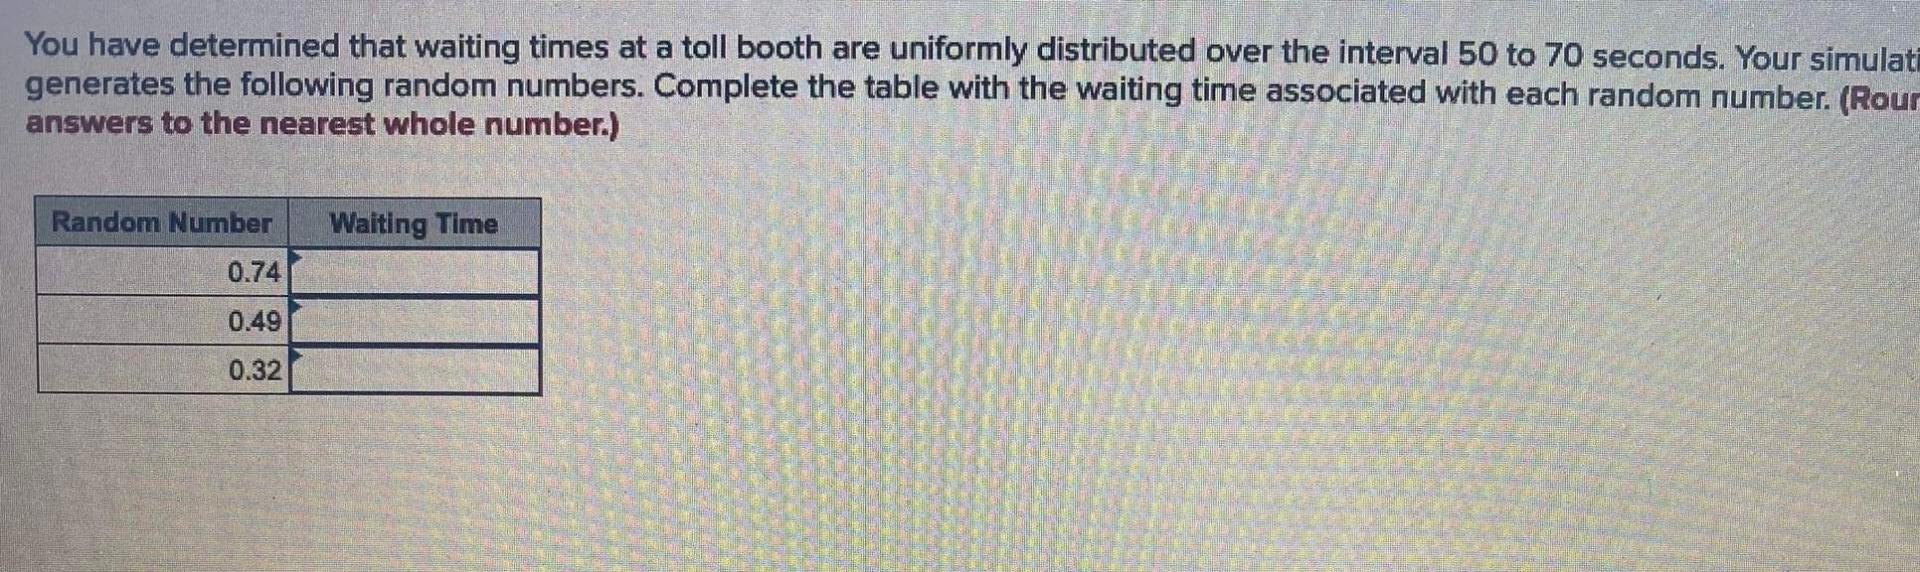
Given this frequency distribution, what demand values would be associated with the following random numbers? (Do not round intermediate calculations.) Demand 0 1 Frequency 24 28 29 19 2 3 Random Number Simulated Demand 0.3 0.4 0.7 You have determined that waiting times at a toll booth are uniformly distributed over the interval 50 to 70 seconds. Your simulati generates the following random numbers. Complete the table with the waiting time associated with each random number. (Rour answers to the nearest whole number.) Random Number Waiting Time 0.74 0.49 0.32
Step by Step Solution
There are 3 Steps involved in it
1 Expert Approved Answer
Step: 1 Unlock

Question Has Been Solved by an Expert!
Get step-by-step solutions from verified subject matter experts
Step: 2 Unlock
Step: 3 Unlock