Question: Gmail 3:55 PM Thu Jun 11 4% Rocket Launch ROCKET LAUNCH PROJECT You can now calculate the area under a curve in many ways. The
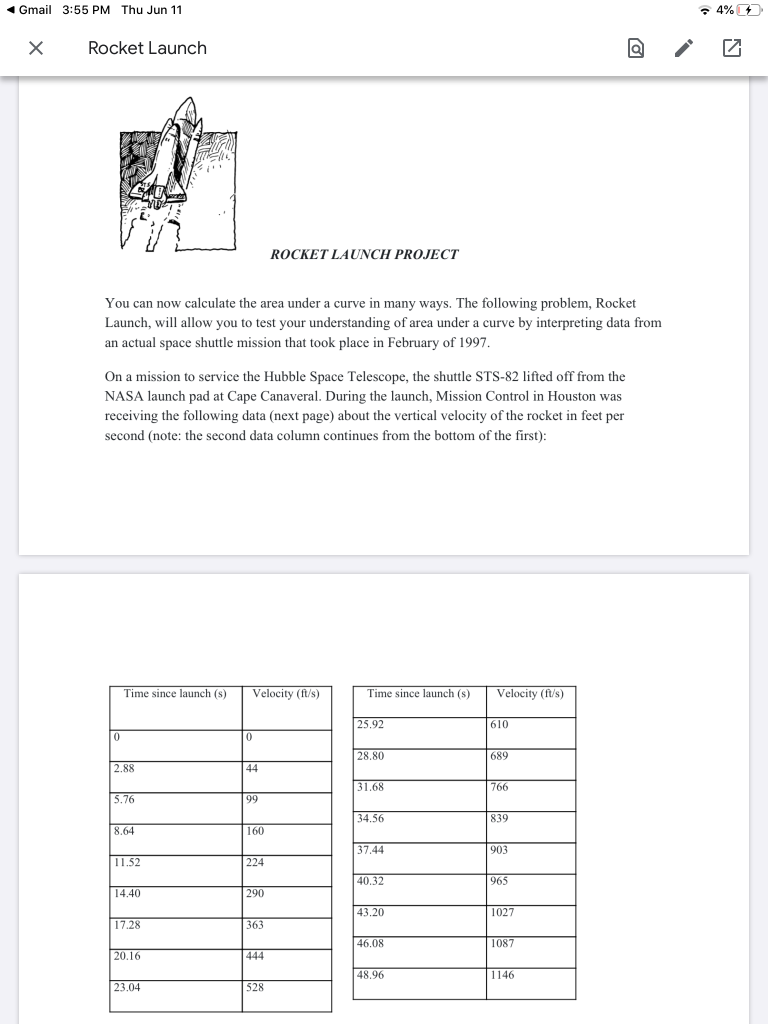
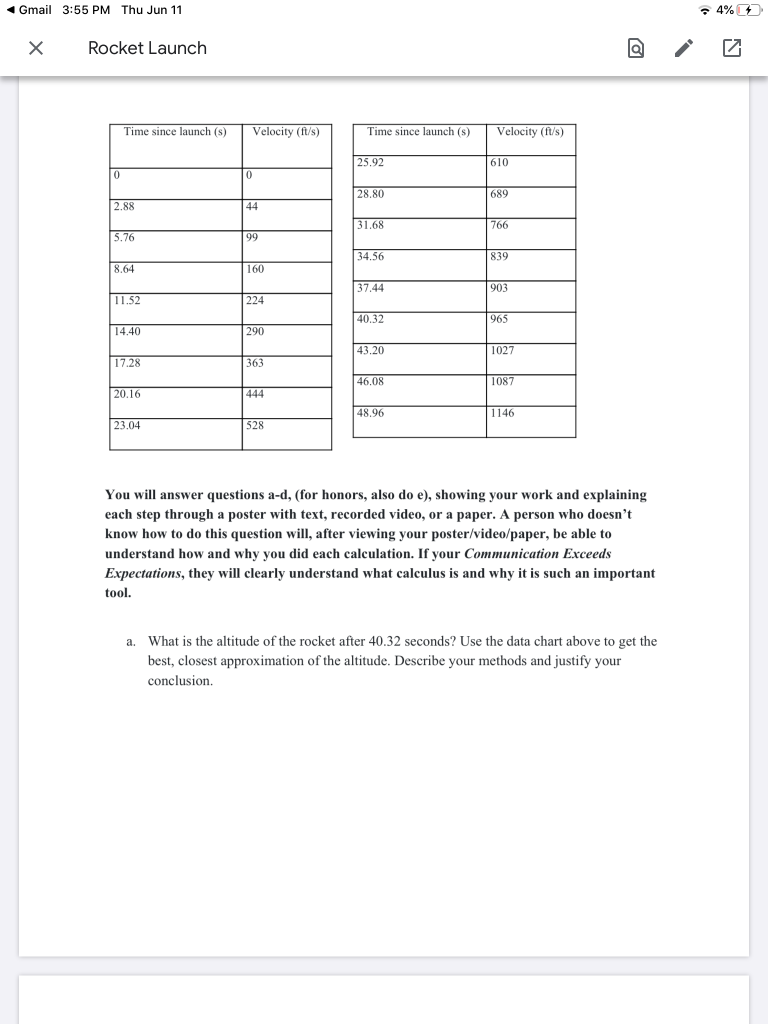
Gmail 3:55 PM Thu Jun 11 4% Rocket Launch ROCKET LAUNCH PROJECT You can now calculate the area under a curve in many ways. The following problem, Rocket Launch, will allow you to test your understanding of area under a curve by interpreting data from an actual space shuttle mission that took place in February of 1997. On a mission to service the Hubble Space Telescope, the shuttle STS-82 lifted off from the NASA launch pad at Cape Canaveral. During the launch, Mission Control in Houston was receiving the following data (next page) about the vertical velocity of the rocket in feet per second (note: the second data column continues from the bottom of the first): Time since launch (S) Velocity (ft/s) Time since launch (s) Velocity (ft/s) 25.92 610 0 10 28.80 689 2.88 44 31.68 766 5.76 99 34.56 839 8.64 160 37.44 903 11.52 224 40.32 965 14.40 290 43.20 1027 17.28 363 46.08 1087 20.16 444 48.96 1146 23.04 528 Gmail 3:55 PM Thu Jun 11 4% Rocket Launch Time since launch (s) Velocity (ft/s) Time since launch (S) Velocity (ft/s) 25.92 610 10 0 28.80 689 2.88 44 31.68 766 5.76 99 34.56 839 8.64 160 37.44 903 11.52 224 40.32 965 14.40 290 43.20 1027 17.28 363 46,08 1087 20.16 444 48.96 1146 23.04 528 You will answer questions a-d, (for honors, also do e), showing your work and explaining each step through a poster with text, recorded video, or a paper. A person who doesn't know how to do this question will, after viewing your poster/video/paper, be able to understand how and why you did each calculation. If your Communication Exceeds Expectations, they will clearly understand what calculus is and why it is such an important tool. a. What is the altitude of the rocket after 40.32 seconds? Use the data chart above to get the best, closest approximation of the altitude. Describe your methods and justify your conclusion b. Make a scatterplot of the velocity data. Rocket Launch e Tool (Desmos) Desmos Accessibility i. What type of function matches the data in the scatterplot? Using (0,0) as the y-intercept, write an equation, vt), for the velocity of the rocket iii. Why does a y-intercept of (0,0) for this function make sense? c. Use the velocity equation you wrote in part (b) to approximate the rocket's altitude for t-40.32 seconds. How does this answer compare to your answer in part (a)? d. What is the approximate altitude of the rocket after t seconds? Write your answer as a function. HONORS/EXTRA CREDIT e. The ozone layer is between 30,000 ft and 150,000 ft above sea level. What is the velocity of the shuttle when it enters the ozone layer? What is the velocity of the shuttle when it exits the ozone layer? Show all of your work clearly. Gmail 3:55 PM Thu Jun 11 4% Rocket Launch ROCKET LAUNCH PROJECT You can now calculate the area under a curve in many ways. The following problem, Rocket Launch, will allow you to test your understanding of area under a curve by interpreting data from an actual space shuttle mission that took place in February of 1997. On a mission to service the Hubble Space Telescope, the shuttle STS-82 lifted off from the NASA launch pad at Cape Canaveral. During the launch, Mission Control in Houston was receiving the following data (next page) about the vertical velocity of the rocket in feet per second (note: the second data column continues from the bottom of the first): Time since launch (S) Velocity (ft/s) Time since launch (s) Velocity (ft/s) 25.92 610 0 10 28.80 689 2.88 44 31.68 766 5.76 99 34.56 839 8.64 160 37.44 903 11.52 224 40.32 965 14.40 290 43.20 1027 17.28 363 46.08 1087 20.16 444 48.96 1146 23.04 528 Gmail 3:55 PM Thu Jun 11 4% Rocket Launch Time since launch (s) Velocity (ft/s) Time since launch (S) Velocity (ft/s) 25.92 610 10 0 28.80 689 2.88 44 31.68 766 5.76 99 34.56 839 8.64 160 37.44 903 11.52 224 40.32 965 14.40 290 43.20 1027 17.28 363 46,08 1087 20.16 444 48.96 1146 23.04 528 You will answer questions a-d, (for honors, also do e), showing your work and explaining each step through a poster with text, recorded video, or a paper. A person who doesn't know how to do this question will, after viewing your poster/video/paper, be able to understand how and why you did each calculation. If your Communication Exceeds Expectations, they will clearly understand what calculus is and why it is such an important tool. a. What is the altitude of the rocket after 40.32 seconds? Use the data chart above to get the best, closest approximation of the altitude. Describe your methods and justify your conclusion b. Make a scatterplot of the velocity data. Rocket Launch e Tool (Desmos) Desmos Accessibility i. What type of function matches the data in the scatterplot? Using (0,0) as the y-intercept, write an equation, vt), for the velocity of the rocket iii. Why does a y-intercept of (0,0) for this function make sense? c. Use the velocity equation you wrote in part (b) to approximate the rocket's altitude for t-40.32 seconds. How does this answer compare to your answer in part (a)? d. What is the approximate altitude of the rocket after t seconds? Write your answer as a function. HONORS/EXTRA CREDIT e. The ozone layer is between 30,000 ft and 150,000 ft above sea level. What is the velocity of the shuttle when it enters the ozone layer? What is the velocity of the shuttle when it exits the ozone layer? Show all of your work clearly


