

Question: Goal: 1. Learn how to create interactive charts with Google Chart Tools 2. Learn how to connect Google Charts with online data sources Requirements: 1.
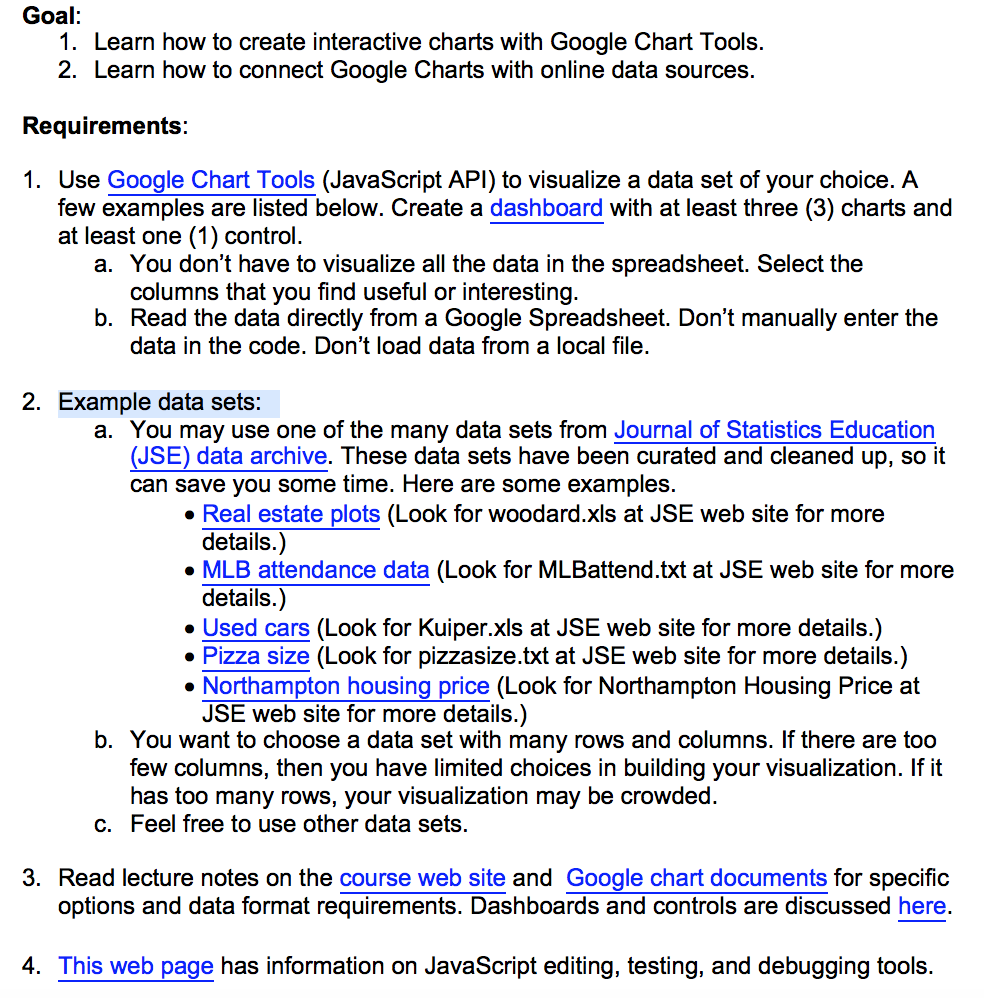
Goal: 1. Learn how to create interactive charts with Google Chart Tools 2. Learn how to connect Google Charts with online data sources Requirements: 1. Use Google Chart Tools (JavaScript API) to visualize a data set of your choice. A few examples are listed below. Create a dashboard with at least three (3) charts and at least one (1) control. a. You don't have to visualize all the data in the spreadsheet. Select the columns that you find useful or interesting b. Read the data directly from a Google Spreadsheet. Don't manually enter the data in the code. Don't load data from a local file 2. Example data sets: a. You may use one of the many data sets from Journal of Statistics Education (JSE) data archive. These data sets have been curated and cleaned up, so it can save you some time. Here are some examples Real estate plots (Look for woodard.xls at JSE web site for more details.) . MLB attendance data (Look for MLBattend.txt at JSE web site for more details.) . Used cars (Look for Kuiper.xls at JSE web site for more details.) Pizza size (Look for pizzasize.txt at JSE web site for more details.) . Northampton housing price (Look for Northampton Housing Price at JSE web site for more details.) b. You want to choose a data set with many rows and columns. If there are too few columns, then you have limited choices in building your visualization. If it has too many rows, your visualization may be crowded c. Feel free to use other data sets 3. Read lecture notes on the course web site and Google chart documents for specific options and data format requirements. Dashboards and controls are discussed here. 4. This web page has information on JavaScript editing, testing, and debugging tools Goal: 1. Learn how to create interactive charts with Google Chart Tools 2. Learn how to connect Google Charts with online data sources Requirements: 1. Use Google Chart Tools (JavaScript API) to visualize a data set of your choice. A few examples are listed below. Create a dashboard with at least three (3) charts and at least one (1) control. a. You don't have to visualize all the data in the spreadsheet. Select the columns that you find useful or interesting b. Read the data directly from a Google Spreadsheet. Don't manually enter the data in the code. Don't load data from a local file 2. Example data sets: a. You may use one of the many data sets from Journal of Statistics Education (JSE) data archive. These data sets have been curated and cleaned up, so it can save you some time. Here are some examples Real estate plots (Look for woodard.xls at JSE web site for more details.) . MLB attendance data (Look for MLBattend.txt at JSE web site for more details.) . Used cars (Look for Kuiper.xls at JSE web site for more details.) Pizza size (Look for pizzasize.txt at JSE web site for more details.) . Northampton housing price (Look for Northampton Housing Price at JSE web site for more details.) b. You want to choose a data set with many rows and columns. If there are too few columns, then you have limited choices in building your visualization. If it has too many rows, your visualization may be crowded c. Feel free to use other data sets 3. Read lecture notes on the course web site and Google chart documents for specific options and data format requirements. Dashboards and controls are discussed here. 4. This web page has information on JavaScript editing, testing, and debugging tools
Step by Step Solution
There are 3 Steps involved in it

Get step-by-step solutions from verified subject matter experts