

Question: So i'm trying to use this data set: https://docs.google.com/spreadsheets/d/1Yjg20TA_quJXDs1ATAjoKkMgYaTSkfm3PXJAou7gf-Y/edit#gid=0 Using the dataset I provided and using Javascript and html. It should get the data from
So i'm trying to use this data set: https://docs.google.com/spreadsheets/d/1Yjg20TA_quJXDs1ATAjoKkMgYaTSkfm3PXJAou7gf-Y/edit#gid=0
Using the dataset I provided and using Javascript and html. It should get the data from the datasheet that I provided and should make three charts. Bar,pie and last one could be anything. I need to have two interactive elements in the chart which I was thinking of something that dealt with the model of the car but that could be anything as well.
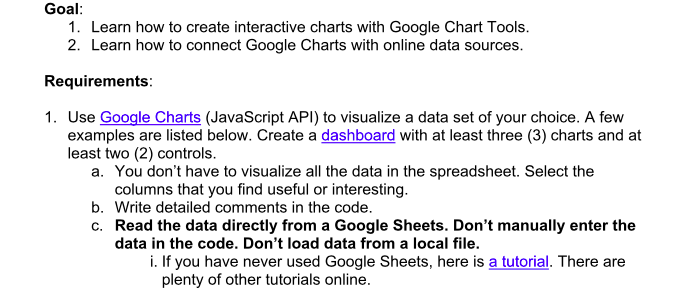
Goal: 1. Learn how to create interactive charts with Google Chart Tools. 2. Learn how to connect Google Charts with online data sources Requirements: 1. Use Google Charts (JavaScript API) to visualize a data set of your choice. A few examples are listed below. Create a dashboard with at least three (3) charts and at least two (2) controls. a. You don't have to visualize all the data in the spreadsheet. Select the columns that you find useful or interesting. b. Write detailed comments in the code. c. Read the data directly from a Google Sheets. Don't manually enter the data in the code. Don't load data from a local file. i. If you have never used Google Sheets, here is a tutorial. There are plenty of other tutorials online
Step by Step Solution
There are 3 Steps involved in it

Get step-by-step solutions from verified subject matter experts