

Question: Good day, QUESTION 2 The data in the table ab0ve represent the market demand and supply for strawberries over a range of prices. Price {cents}
Good day,
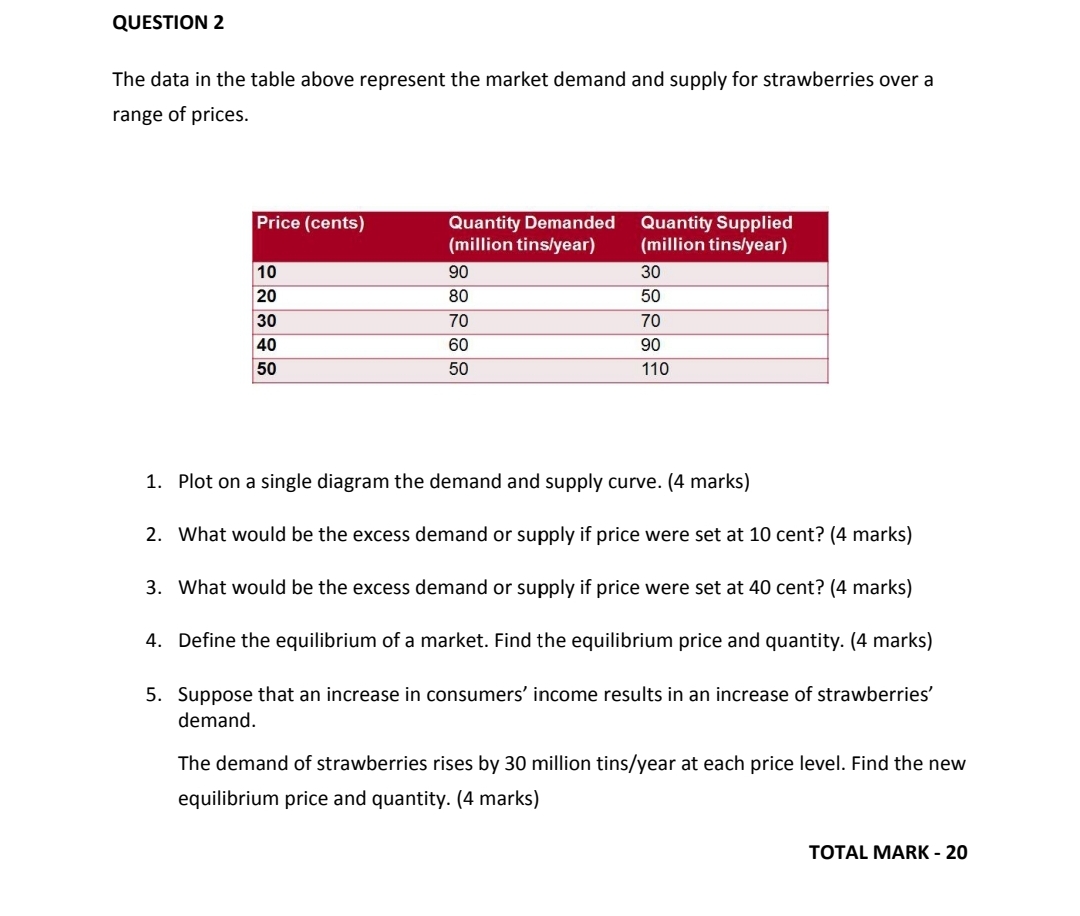
QUESTION 2 The data in the table ab0ve represent the market demand and supply for strawberries over a range of prices. Price {cents} Quantity Demanded Quantity Supplied {milliontinsfyear} {milliontinslyeal} 90 30 80 50 50 110 1. Plot on a single diagram the demand and supply curve. (4 marks) 2. What would be the excess demand or supply if price were set at 10 cent? (4 marks} 3. What would be the excess demand or supply if price were set at 40 cent? (4 marks) 4. Define the equilibrium of a market. Find the equilibrium price and quantity. (4 marks} 5. Suppose that an increase in consumers' income results in an increase of strawberries' demand. The demand of strawberries rises by 30 million tins/year at each price level. Find the new equilibrium price and quantity. (4 marks} TOTAL MARK - 20
Step by Step Solution
There are 3 Steps involved in it

Get step-by-step solutions from verified subject matter experts