

Question: The data in the table above represent the market demand and supply for strawberries over a ange of prices. Price (cents) Quantity Demanded Quantity Supplied
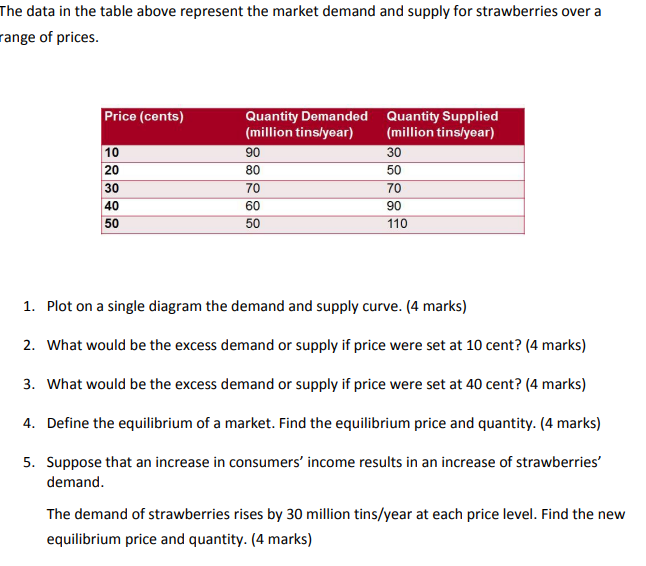
The data in the table above represent the market demand and supply for strawberries over a ange of prices. Price (cents) Quantity Demanded Quantity Supplied (million tins/year) (million tins/year) 10 90 30 20 80 50 30 70 70 40 60 90 50 50 110 1. Plot on a single diagram the demand and supply curve. (4 marks) 2. What would be the excess demand or supply if price were set at 10 cent? (4 marks) 3. What would be the excess demand or supply if price were set at 40 cent? (4 marks) 4. Define the equilibrium of a market. Find the equilibrium price and quantity. (4 marks) 5. Suppose that an increase in consumers' income results in an increase of strawberries' demand. The demand of strawberries rises by 30 million tins/year at each price level. Find the new equilibrium price and quantity. (4 marks)
Step by Step Solution
There are 3 Steps involved in it

Get step-by-step solutions from verified subject matter experts