

Question: Good Morning U A B C D E F G H J K L M N O P Q R S T V t (s)
Good Morning
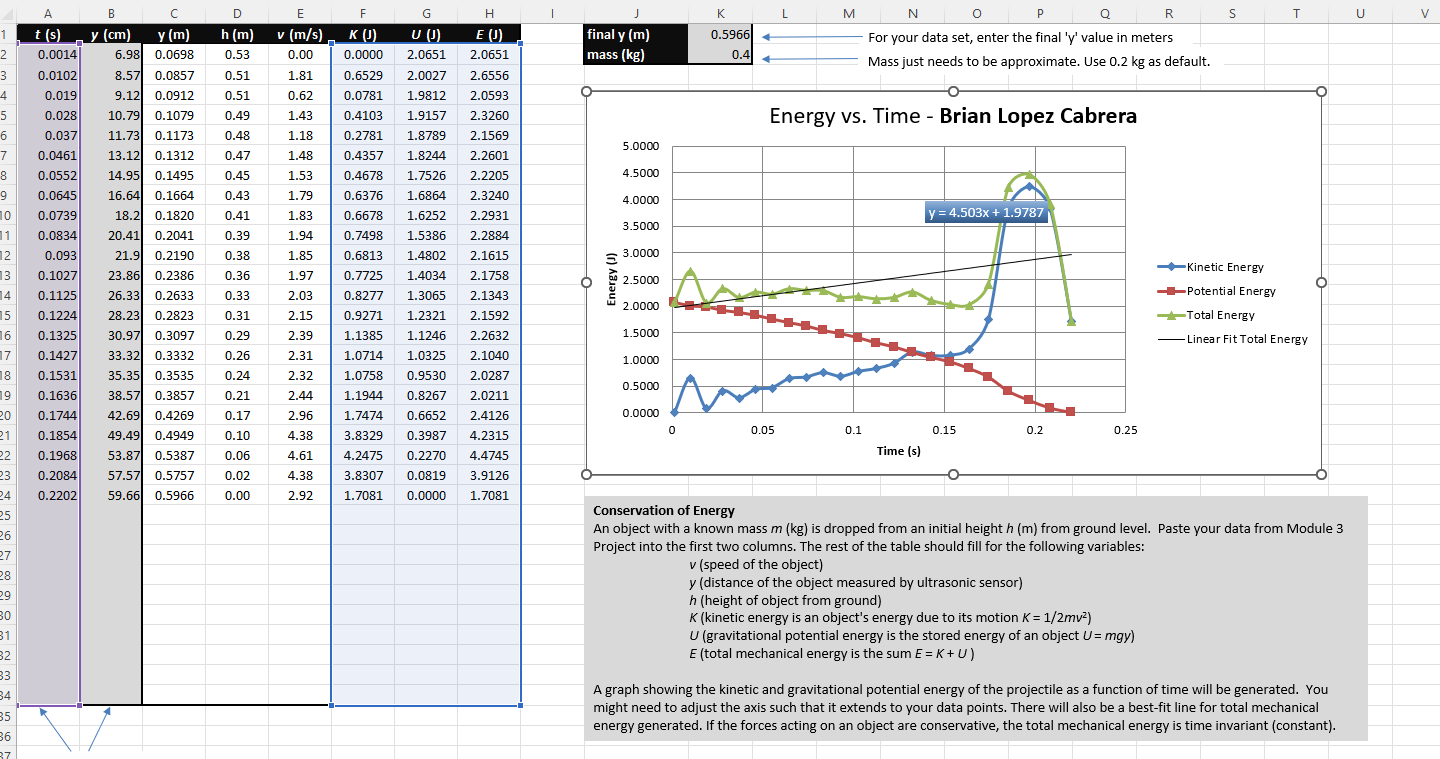
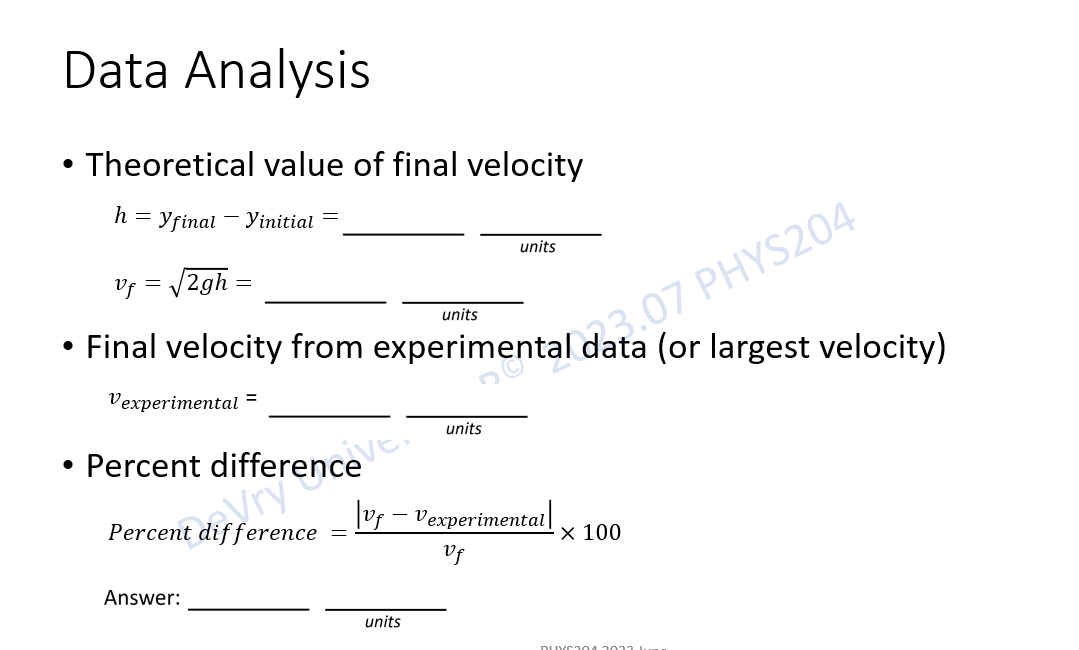
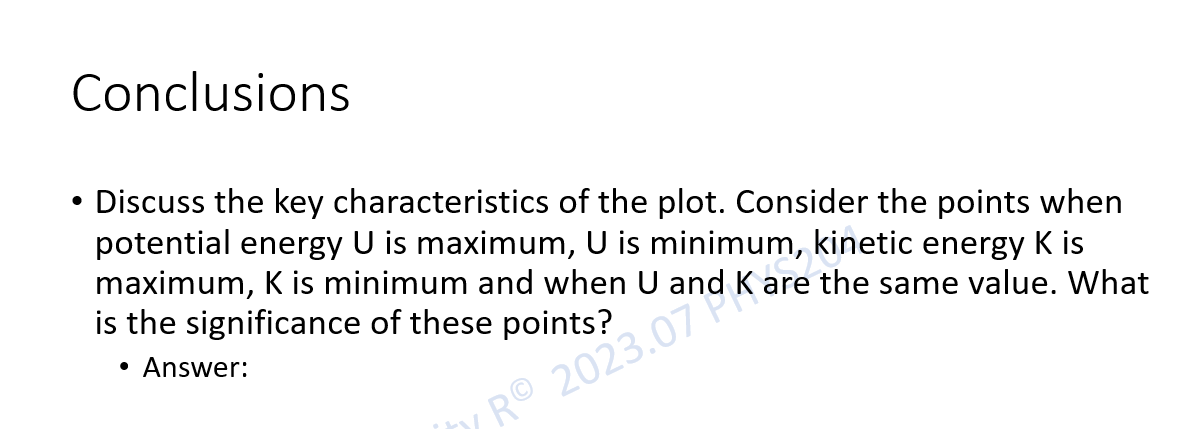

U A B C D E F G H J K L M N O P Q R S T V t (s) y (cm) y (m) (m) v (m/s) K J) U () E (J) final y (m) 0.5966 For your data set, enter the final 'y' value in meters 0.0014 5.98 0.0698 0.53 0.00 0.0000 2.0651 2.0651 mass (kg) 0.4 Mass just needs to be approximate. Use 0.2 kg as default. 0.0102 8.57 0.0857 0.51 1.81 0.6529 2.0027 2.6556 0.019 9.12 0.0912 0.51 0.62 0.0781 1.9812 2.0593 0.028 10.79 0.1079 0.49 1.43 0.4103 1.9157 2.3260 Energy vs. Time - Brian Lopez Cabrera 0.037 11.73 0.1173 0.48 1.18 0.2781 1.8789 2.1569 5.0000 0.0461 13.12 0.1312 0.47 1.48 0.4357 1.8244 2.2601 0.0552 14.95 0.1495 0.45 1.53 0.4678 1.7526 2.2205 4.5000 0.0645 16.64 0.1664 0.43 1.79 0.6376 1.6864 2.3240 4.0000 0.0739 18.2 0.1820 0.41 1.83 0.6678 1.6252 2.2931 y = 4.503x + 1.9787 3.5000 0.0834 20.41 0.2041 0.39 1.94 0.7498 1.5386 2.2884 0.093 21.9 0.2190 0.38 1.85 0.6813 1.4802 2.1615 3.0000 Kinetic Energy 0.1027 23.86 0.2386 0.36 1.97 0.7725 1.4034 2.1758 O Energy (J) 2.5000 0.1125 26.33 0.2633 0.33 2.03 0.8277 1.3065 Potential Energy 2.1343 2.0000 0.1224 28.23 0.2823 0.31 2.15 0.9271 1.2321 2.1592 Total Energy 0.1325 30.97 0.3097 0.29 2.39 1.1385 1.1246 2.2632 1.5000 - Linear Fit Total Energy 0.1427 33.32 0.3332 0.26 2.31 1.0714 1.0325 2.1040 1.0000 0.1531 35.35 0.3535 0.24 2.32 1.0758 0.9530 2.0287 0.5000 0.1636 38.57 0.3857 0.21 2.44 1.1944 0.8267 2.0211 0.0000 A 20 0.1744 42.69 0.4269 0.17 2.96 1.7474 0.6652 2.4126 0.05 0.1 0.15 0.2 0.25 0.1854 49.49 0.4949 0.10 4.38 3.8329 0.3987 4.2315 Time (s) 0.1968 53.87 0.5387 0.06 4.61 4.2475 0.2270 4.4745 0.2084 57.57 0.5757 0.02 4.38 3.8307 0.0819 3.9126 0.2202 59.66 0.5966 0.00 2.92 1.7081 0.0000 1.7081 Conservation of Energy An object with a known mass m (kg) is dropped from an initial height h (m) from ground level. Paste your data from Module 3 Project into the first two columns. The rest of the table should fill for the following variables: v (speed of the object) y (distance of the object measured by ultrasonic sensor) h (height of object from ground) K (kinetic energy is an object's energy due to its motion K = 1/2mv2) U (gravitational potential energy is the stored energy of an object U= mgy) E (total mechanical energy is the sum E = K + U ) A graph showing the kinetic and gravitational potential energy of the projectile as a function of time will be generated. You might need to adjust the axis such that it extends to your data points. There will also be a best-fit line for total mechanical energy generated. If the forces acting on an object are conservative, the total mechanical energy is time invariant (constant). 36Data Analysis Theoretical value of final velocity h : yfina1_ yinitint : units units Final velocity from experimental data (or largest velocity) \"experimental = units Percent difference _ lvf _ \"experimental Percent difference X 100 I? f Answer: units Conclusions Discuss the key characteristics of the plot. Consider the points when potential energy U is maximum, U is minimum, kinetic energy K is maximum, K is minimum and when U and K are the same value. What is the significance of these points? ' Answer: Conclusions What is the trend of the best fit line for the total energy E in your data? If the data is accurate, the total mechanical energy should decrease slightly. Why is that
Step by Step Solution
There are 3 Steps involved in it

Get step-by-step solutions from verified subject matter experts