

Question: goodman tire case Question 1: (20 points) 1a. Draw a histogram of these data. 1b. What can you conclude about the distribution of the tread
goodman tire case 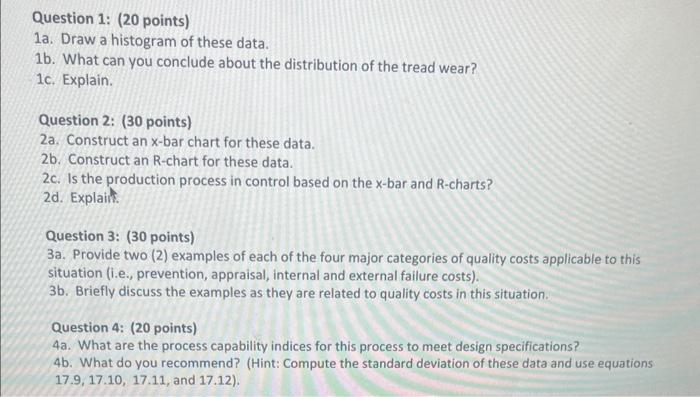
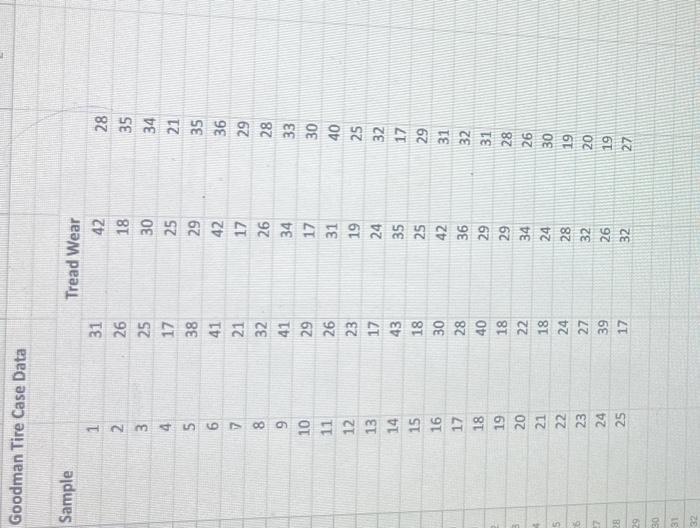
Question 1: (20 points) 1a. Draw a histogram of these data. 1b. What can you conclude about the distribution of the tread wear? 1c. Explain. Question 2: (30 points) 2a. Construct an x-bar chart for these data. 2b. Construct an R-chart for these data. 2c. Is the production process in control based on the x-bar and R-charts? 2d. Explain. Question 3: (30 points) 3a. Provide two (2) examples of each of the four major categories of quality costs applicable to this situation (i.e., prevention, appraisal, internal and external failure costs). 3b. Briefly discuss the examples as they are related to quality costs in this situation. Question 4: ( 20 points) 4a. What are the process capability indices for this process to meet design specifications? 4b. What do you recommend? (Hint: Compute the standard deviation of these data and use equations 17.9,17.10,17.11, and 17.12)
Step by Step Solution
There are 3 Steps involved in it
1 Expert Approved Answer
Step: 1 Unlock

Question Has Been Solved by an Expert!
Get step-by-step solutions from verified subject matter experts
Step: 2 Unlock
Step: 3 Unlock