Question: - Google Chrome on.com/myitlab-business-service/project/launch Assignment Instructions 6 15 On the 3-D pie chart, edit the Chart Title to read Semi- Annual Advertising Costs. Apply Style
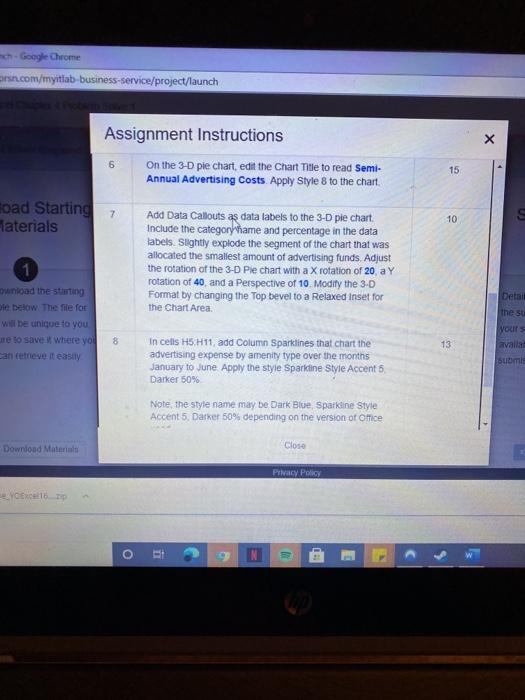
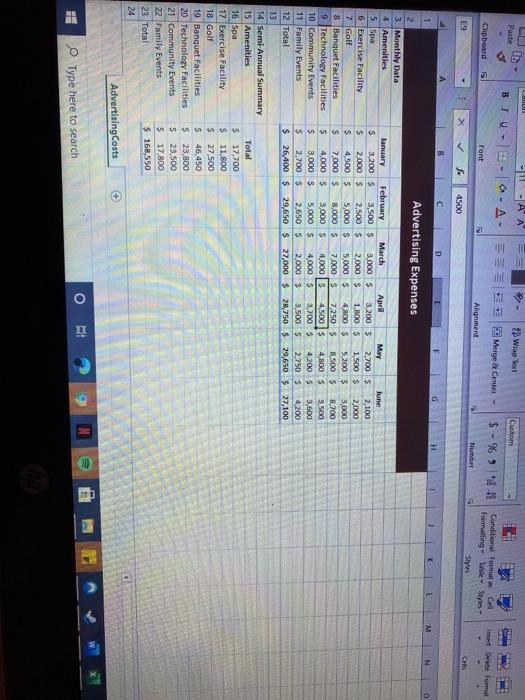
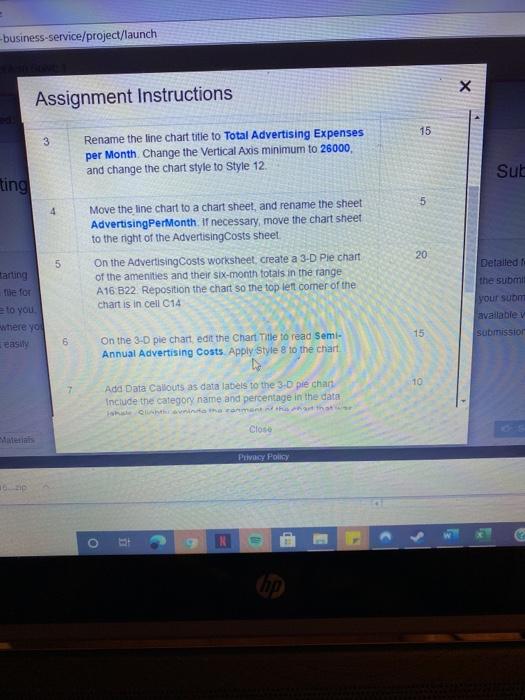
- Google Chrome on.com/myitlab-business-service/project/launch Assignment Instructions 6 15 On the 3-D pie chart, edit the Chart Title to read Semi- Annual Advertising Costs. Apply Style 8 to the chart. road Starting 7 aterials 10 S Add Data Callouts as data labels to the 3-D ple chart Include the category hame and percentage in the data labels. Slightly explode the segment of the chart that was allocated the smallest amount of advertising funds. Adjust the rotation of the 3-0 Pie chart with a x rotation of 20 a Y rotation of 40, and a Perspective of 10 Modify the 3-D Format by changing the Top bevel to a Relaxed Inset for the Chart Area Detail (the su ownload the starting e below. The file for will be unique to you e to save where you can retrieve it easily 8 13 Ivours avalla Submit In cells H5,H11, add Column Sparklines that chart the advertising expense by amenity type over the months January to June Apply the style Sparkline Style Accent 5. Darker 50% Note the style name may be Dark Blue, Sparkline Style Accent 5. Darker 50% depending on the version of mice Download Material Close Privacy Policy 16. O i W E MUR Paste Custom BIU- A-A- Wiap Text Merge the Center - 1 $ % 9 9.13 Clipboard met Delete Format 5 Font Alignment Conditional Format Call formatting Table Styles - Styles Number Cat 4500 G M D May lune 2,700 $ 2,100 1.500 5 2,000 5,200 $ 3.000 8,500 $ 8.700 4,800 $ 9.500 4,200 $ 3,600 2,750 $ 4,200 29,650 $ 27,100 B 1 Advertising Expenses 2. 3 Monthly Data 4 Amenities January February March April 5 Spa $ 3,200 $ 3,500 3.000 $ 3,200 $ 6 Exercise Facility $ 2,000 $ 2,500 $ 2,000 $ 1,800 $ 7 Golf $ 4,500 $ 5,000 $ 5,000 $ 4,800 $ 8 Banquet Facilities $ 7,000 $ 8,000 $ 7,000 $ 7,250 $ 9 Technology Facilities $ 4,000 $ 3,000 $ 4,000 4,500 $ 10 Community Events $ 3,000 $ 5,000 $ 4,000 $ 3,700$ 11 Family Events $ 2,700 S 2,650 $ 2.000 $ 3,500 $ 12 Total $ 26,400 $ 29,650 $ 27,000 $ 28,750 $ 13 14 Semi-Annual Summary 15 Amenities Total 16 Spa $ 17,700 17 Exercise Facility $ 11,800 18 Golf $ 27,500 19 Banquet Facilities 546,450 20 Technology Facilities $ 23,800 21 Community Events $ 23,500 22 Family Events $ 17,800 23 Total $ 168,550 24 Advertising Costs . O Type here to search business-service/project/launch X Assignment Instructions 15 3 Rename the line chart title to Total Advertising Expenses per Month Change the Vertical Axis minimum to 26000 and change the chart style to Style 12. Sul ting 5 4 Move the line chart to a chart sheet, and rename the sheet Advertising PerMonth. If necessary, move the chart sheet to the right of the Advertising Costs sheet On the Advertising Costs worksheet, create a 3-D Pie chart of the amenities and their six-month totals in the range A16B22 Reposition the chart so the top left comer of the chart is in cell C14 20 5 Detailed : the submit tarting file for to you your sum available were you 15 Submission 6 On the 3-D pie chart edit the Chart Title to read Semi- Annual Advertising Costs Apply Style 8 to the chart 10 Add Data Callouts as data labels to the 3-D pie chart Include the category name and percentage in the data his linha ramantha Close Materials Privacy Policy o E - Google Chrome on.com/myitlab-business-service/project/launch Assignment Instructions 6 15 On the 3-D pie chart, edit the Chart Title to read Semi- Annual Advertising Costs. Apply Style 8 to the chart. road Starting 7 aterials 10 S Add Data Callouts as data labels to the 3-D ple chart Include the category hame and percentage in the data labels. Slightly explode the segment of the chart that was allocated the smallest amount of advertising funds. Adjust the rotation of the 3-0 Pie chart with a x rotation of 20 a Y rotation of 40, and a Perspective of 10 Modify the 3-D Format by changing the Top bevel to a Relaxed Inset for the Chart Area Detail (the su ownload the starting e below. The file for will be unique to you e to save where you can retrieve it easily 8 13 Ivours avalla Submit In cells H5,H11, add Column Sparklines that chart the advertising expense by amenity type over the months January to June Apply the style Sparkline Style Accent 5. Darker 50% Note the style name may be Dark Blue, Sparkline Style Accent 5. Darker 50% depending on the version of mice Download Material Close Privacy Policy 16. O i W E MUR Paste Custom BIU- A-A- Wiap Text Merge the Center - 1 $ % 9 9.13 Clipboard met Delete Format 5 Font Alignment Conditional Format Call formatting Table Styles - Styles Number Cat 4500 G M D May lune 2,700 $ 2,100 1.500 5 2,000 5,200 $ 3.000 8,500 $ 8.700 4,800 $ 9.500 4,200 $ 3,600 2,750 $ 4,200 29,650 $ 27,100 B 1 Advertising Expenses 2. 3 Monthly Data 4 Amenities January February March April 5 Spa $ 3,200 $ 3,500 3.000 $ 3,200 $ 6 Exercise Facility $ 2,000 $ 2,500 $ 2,000 $ 1,800 $ 7 Golf $ 4,500 $ 5,000 $ 5,000 $ 4,800 $ 8 Banquet Facilities $ 7,000 $ 8,000 $ 7,000 $ 7,250 $ 9 Technology Facilities $ 4,000 $ 3,000 $ 4,000 4,500 $ 10 Community Events $ 3,000 $ 5,000 $ 4,000 $ 3,700$ 11 Family Events $ 2,700 S 2,650 $ 2.000 $ 3,500 $ 12 Total $ 26,400 $ 29,650 $ 27,000 $ 28,750 $ 13 14 Semi-Annual Summary 15 Amenities Total 16 Spa $ 17,700 17 Exercise Facility $ 11,800 18 Golf $ 27,500 19 Banquet Facilities 546,450 20 Technology Facilities $ 23,800 21 Community Events $ 23,500 22 Family Events $ 17,800 23 Total $ 168,550 24 Advertising Costs . O Type here to search business-service/project/launch X Assignment Instructions 15 3 Rename the line chart title to Total Advertising Expenses per Month Change the Vertical Axis minimum to 26000 and change the chart style to Style 12. Sul ting 5 4 Move the line chart to a chart sheet, and rename the sheet Advertising PerMonth. If necessary, move the chart sheet to the right of the Advertising Costs sheet On the Advertising Costs worksheet, create a 3-D Pie chart of the amenities and their six-month totals in the range A16B22 Reposition the chart so the top left comer of the chart is in cell C14 20 5 Detailed : the submit tarting file for to you your sum available were you 15 Submission 6 On the 3-D pie chart edit the Chart Title to read Semi- Annual Advertising Costs Apply Style 8 to the chart 10 Add Data Callouts as data labels to the 3-D pie chart Include the category name and percentage in the data his linha ramantha Close Materials Privacy Policy o E