

Question: Google Stuff Carleton. US Open NHL66 | NHL Streams M Gmail b=(sumxx sumxy - sumxxx sumy)+ (sumxx sumx-nx sumxx) where: Page 1 YouTube sumx
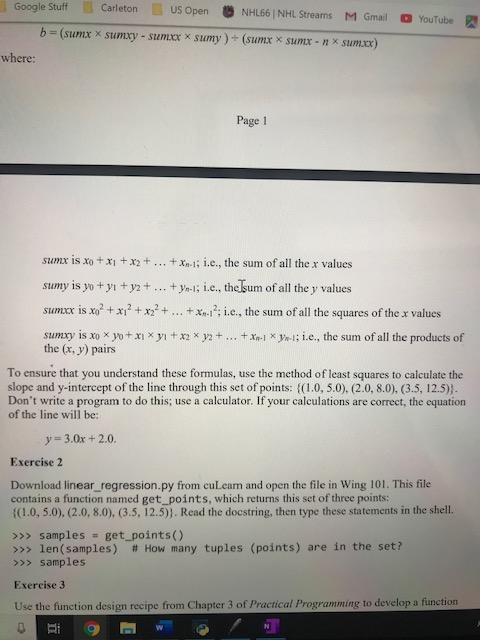
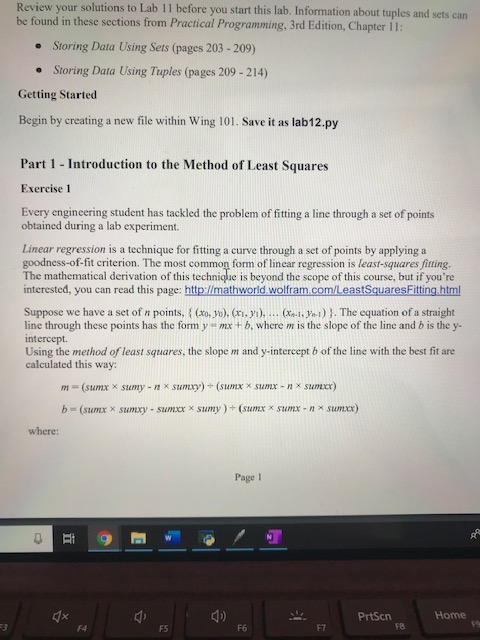
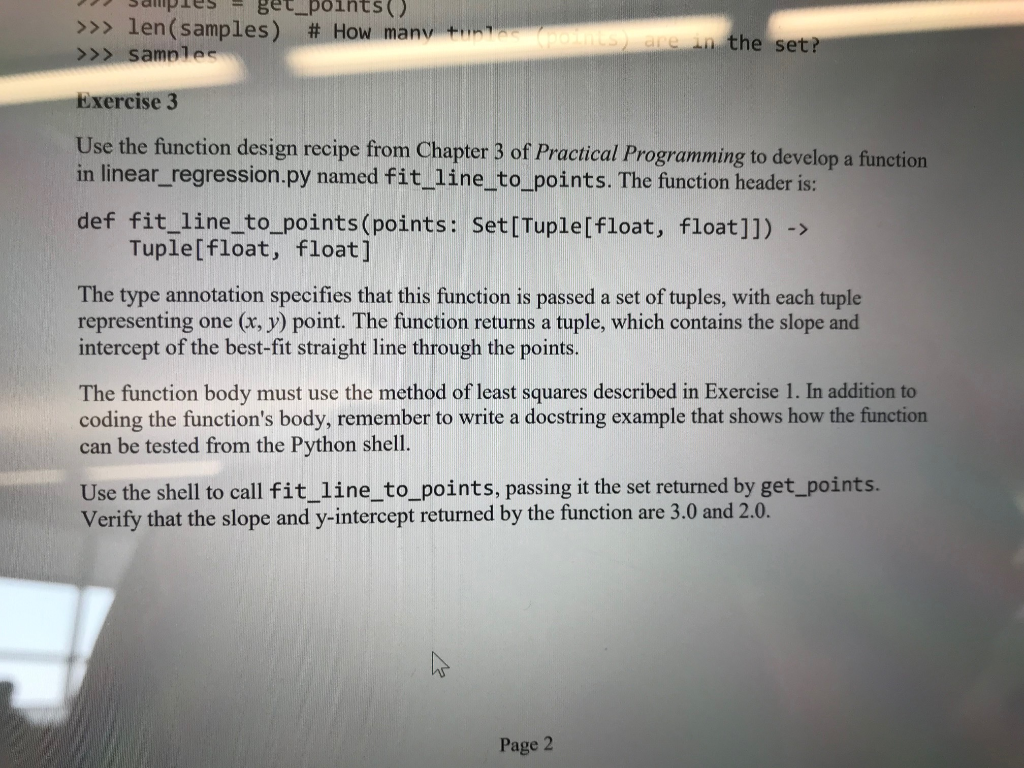
Google Stuff Carleton. US Open NHL66 | NHL Streams M Gmail b=(sumxx sumxy - sumxxx sumy)+ (sumxx sumx-nx sumxx) where: Page 1 YouTube sumx is xo + x1 + x + ... + xn-1; i.e., the sum of all the x values sumy is yo + y + y2 + ... +yn-1; i.e., the sum of all the y values sumxx is x + x + x22+...+x-1; i.e., the sum of all the squares of the x values sumxy is xox yo+x1x y + x2 x y2 + ... +X-1 xy-1; i.e., the sum of all the products of the (x, y) pairs y=3.0x +2.0. To ensure that you understand these formulas, use the method of least squares to calculate the slope and y-intercept of the line through this set of points: {(1.0, 5.0), (2.0, 8.0), (3.5, 12.5)). Don't write a program to do this; use a calculator. If your calculations are correct, the equation of the line will be: Exercise 2 Download linear_regression.py from cuLearn and open the file in Wing 101. This file contains a function named get_points, which returns this set of three points: {(1.0, 5.0), (2.0, 8.0), (3.5, 12.5)). Read the docstring, then type these statements in the shell. >>> samples = get_points() >>> len (samples) # How many tuples (points) are in the set? >>> samples Exercise 3 Use the function design recipe from Chapter 3 of Practical Programming to develop a function 4 Bi Review your solutions to Lab 11 before you start this lab. Information about tuples and sets can be found in these sections from Practical Programming, 3rd Edition, Chapter 11: Storing Data Using Sets (pages 203 - 209) Storing Data Using Tuples (pages 209-214) Getting Started Begin by creating a new file within Wing 101. Save it as lab12.py Part 1 - Introduction to the Method of Least Squares Exercise 1 Every engineering student has tackled the problem of fitting a line through a set of points obtained during a lab experiment. Linear regression is a technique for fitting a curve through a set of points by applying a goodness-of-fit criterion. The most common form of linear regression is least-squares fitting. The mathematical derivation of this technique is beyond the scope of this course, but if you're interested, you can read this page: http://mathworld.wolfram.com/LeastSquaresFitting.html Suppose we have a set of n points, {(xo, yo), (X, Y), ... (Xn-1, -1)}. The equation of a straight line through these points has the form y=mx+b, where m is the slope of the line and b is the y- intercept. Using the method of least squares, the slope m and y-intercept b of the line with the best fit are calculated this way: m=(sumxx sumy - nx sumxy) + (sumx sumxnx sumxx) b- (sumxx sumxy-sumxxx sumy)+(sumxx sumx-nx sumxx) where: O Et F4 F5 Page 1 1 F6 F7 PrtScn FB Home RP F9 oints() >>> len (samples) # How many tuples (points) are in the set? >>> samples Exercise 3 Use the function design recipe from Chapter 3 of Practical Programming to develop a function in linear regression.py named fit_line_to_points. The function header is: def fit_line_to_points (points: Set [Tuple [float, float]]) -> Tuple [float, float] The type annotation specifies that this function is passed a set of tuples, with each tuple representing one (x, y) point. The function returns a tuple, which contains the slope and intercept of the best-fit straight line through the points. The function body must use the method of least squares described in Exercise 1. In addition to coding the function's body, remember to write a docstring example that shows how the function can be tested from the Python shell. Use the shell to call fit_line_to_points, passing it the set returned by get_points. Verify that the slope and y-intercept returned by the function are 3.0 and 2.0. Page 2
Step by Step Solution
3.34 Rating (157 Votes )
There are 3 Steps involved in it
It appears that you are trying to find the slope m and yintercept b of the bestfit line for a set of ... View full answer

Get step-by-step solutions from verified subject matter experts